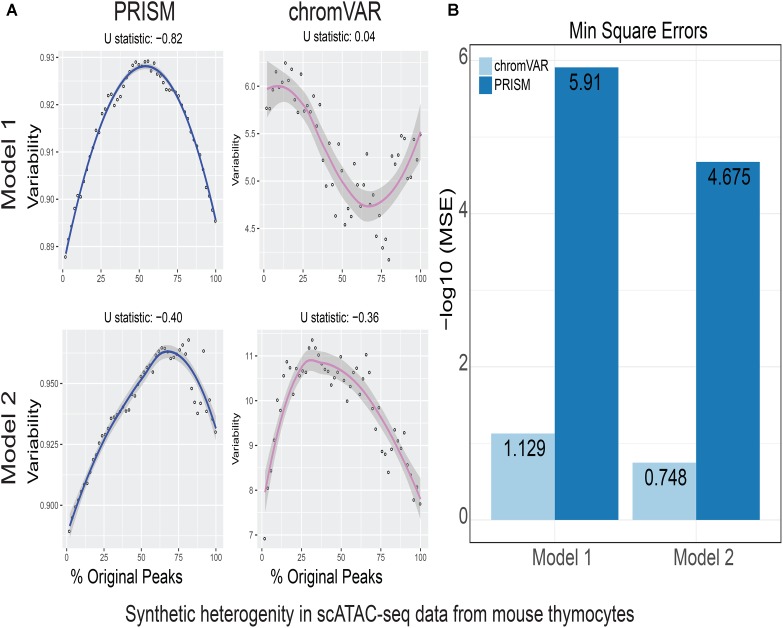
FIGURE 3.
Simulations of cell-to-cell heterogeneity in mouse double-positive T cells. PRISM outperforms chromVAR for data generated under two models when heterogeneity was generated for mouse double positive T cells (Johnson et al., 2018). (A) In model 1 subtype A, chromVAR does not conform to an inverse-U shape while PRISM does. In model 2 subtype A, chromVAR deviates from the curve of best fit more than PRISM. In order to see how well a simulation fit an inverse-U shape (concave curve), a test of concavity (U statistic) was designed. The difference between variability of successive proportions of cells expressing original peaks was calculated. Then the Spearman correlation of this ordering with the decreasing number sequence 49 through 1 was calculated. This can be seen as checking to see if the derivative (slope) is continuously decreasing. Values close to 1 are ideal. (B) PRISM’s measurements were also significantly less noisy (stochastic) compared to chromVAR. To measure noise, we calculated the mean squared error (MSE), or average squared distance of each point from the LOESS curve. PRISM showed orders of magnitude smaller MSE values. The MSE is plotted on -log10 scale.

