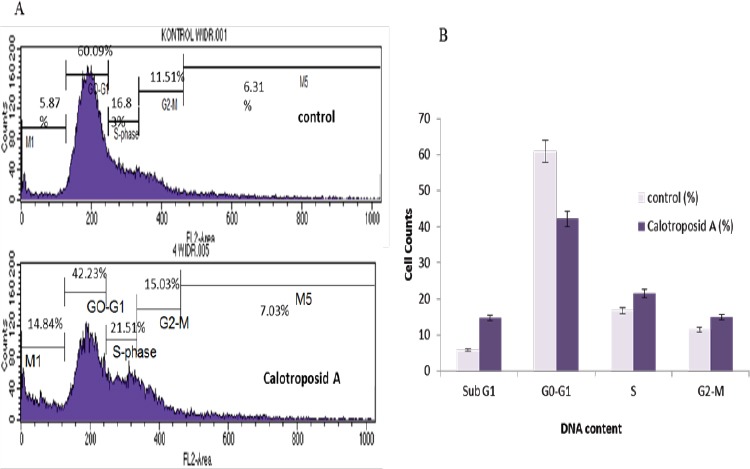
Figure 2.

The Induction Effect of Cell Death and Distribution Changes on Cell Cycle Phases on WiDr Cells Due to Calotroposid A Treatment at IC50 17.23 µg/ml. As many as 5x10⁵ cells/well of WiDr cells were incubated for 24 hours and then treated with Calotroposide A on IC50. The distribution profile of each phase (Sub G1, G0-G1, S, and G2/M) in the cell cycle was analyzed using flow cytometry with propidium iodide staining (PI).
