Figure 3.

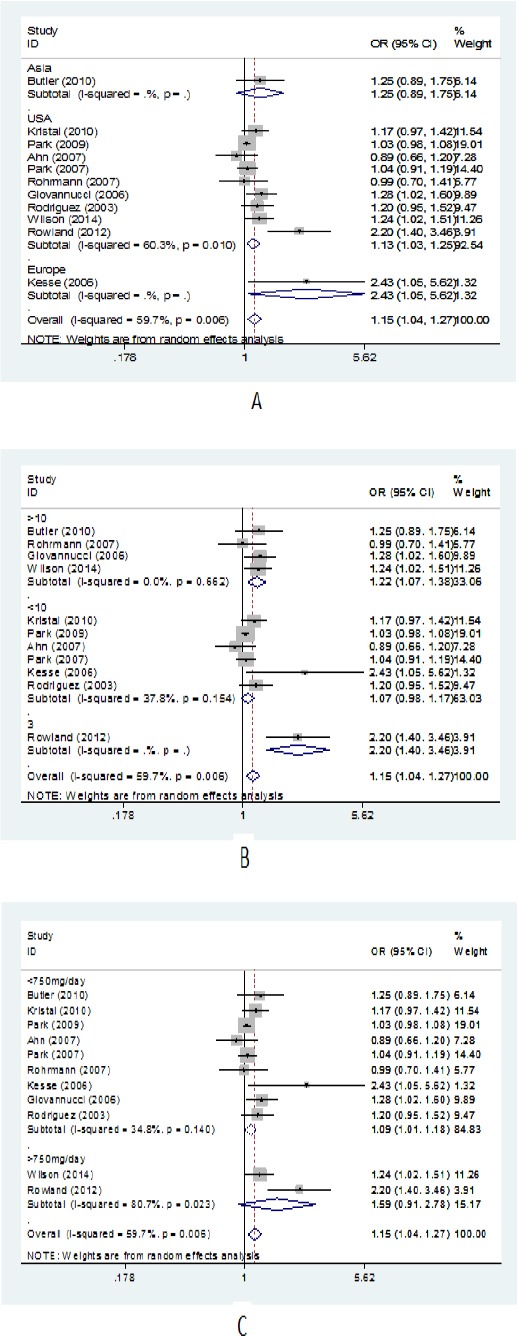
Forest Plot of the Subgroup Analysis Based on Continent (A), the Continent (B), Dose of Consumable (C) for Relationship between Calcium Intake and Total Prostate Cancer

Forest Plot of the Subgroup Analysis Based on Continent (A), the Continent (B), Dose of Consumable (C) for Relationship between Calcium Intake and Total Prostate Cancer