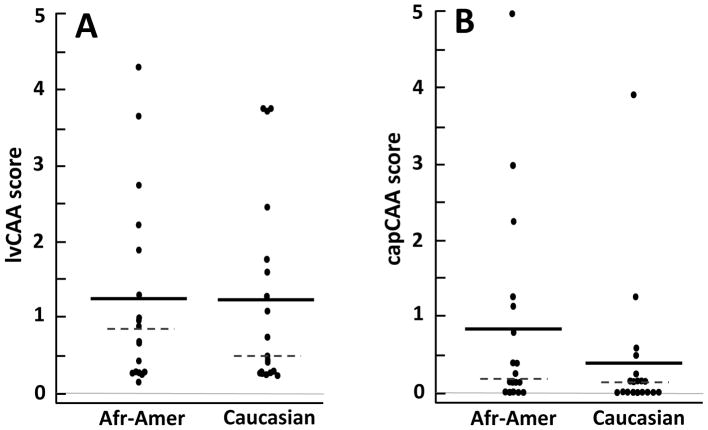
FIGURE 3.
Distribution of CAA scores in 18 African-American (Afr-Amer) and 19 Caucasian subjects. Each dot represents the mean score of the 4 brain regions for lvCAA (A) and capCAA (B) in each subject. The group means are indicated by the solid bars, and the medians by the dashed lines. There were no statistically significant differences in the amount of lvCAA (p = 0.94) or capCAA (p = 0.13) between the two ethnoracial groups.

