
Figure 3.
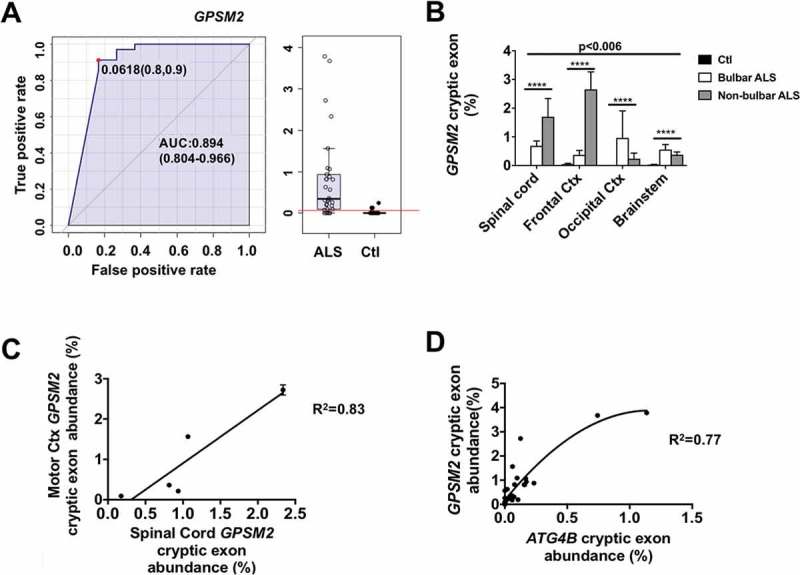
GPSM2 cryptic exon abundance depends on disease type and region. Values of GPSM2 mRNA analyses (± standard error) indicate that (a) GPSM2 cryptic exon levels are higher in samples from ALS when compared with controls. (b) RT-qPCR of GPSM2 cryptic exons shows different expression levels in spinal cord, frontal cortex, occipital cortex, and brain stem. (c) Linear regression between the amount of cryptic exons in GPSM2 in lumbar spinal cord and motor cortex (Ctx). (d) Tissue concentrations of cryptic exons in ATG4B and GPSM2 correlate positively in a non-linear fashion. For (b), *** p < 0.001 and **** p < 0.0001 for disease type in a 2-way ANOVA accounting for disease type and anatomic region. AUC, area under the curve.