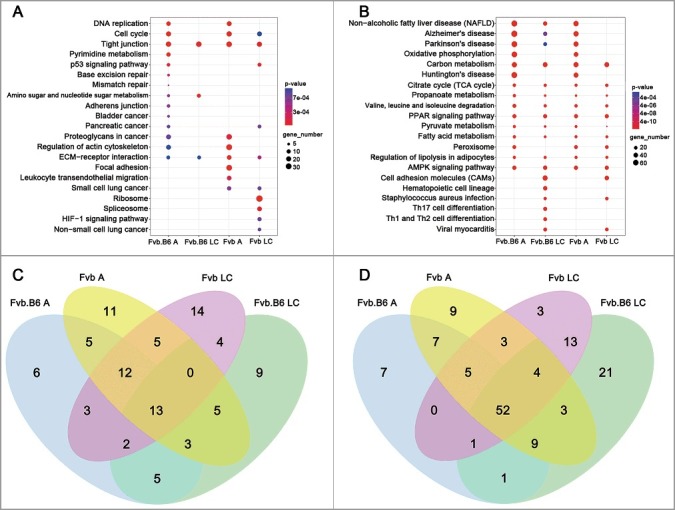
Figure 2.

Pathway enrichment analysis. (A-B) KEGG enrichment of the up-regulated (A) and down-regulated (B) DEGs at the adenoma and late carcinoma stages in the two types of mice. The pathways with the most significant p-values were plotted. (C-D) Venn diagram showing the number of significant KEGG pathways (p-value < 0.05) by using the up-regulated (C) and down-regulated (D) DEGs at the adenoma and late carcinoma stages in the two types of mice. Expression levels are depicted according to the color bar beside the heat map. A, adenoma; LC, late carcinoma.
