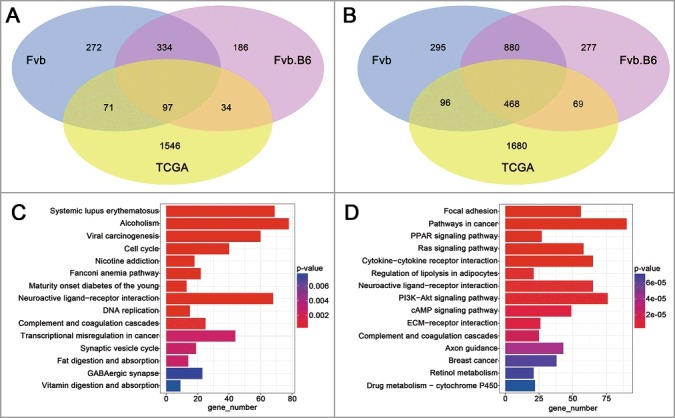
Figure 5.

Analysis of TCGA data. (A-B) Venn diagram showing the numbers of the up-regulated (A) and down-regulated (B) genes with significant changes (p < 0.05) in expression in the TCGA human breast carcinoma samples and late carcinoma stage of the mice. (C-D) KEGG enrichment of the up-regulated (C) and down-regulated (D) DEGs in TCGA human breast carcinoma samples. The pathways with the most significant p-values were plotted, and the expression levels are depicted according to the color bar beside the heat map.
