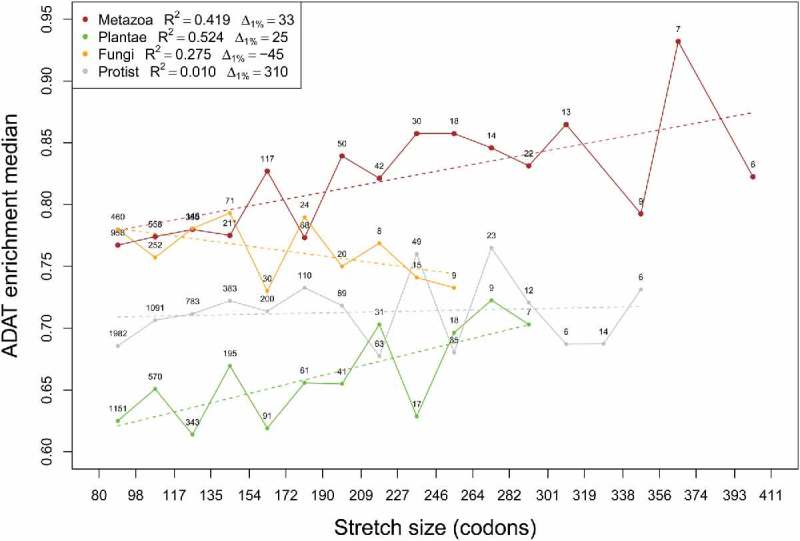
Figure 6.

Median values of ADAT-sensitive codon enrichment by length of ADAT amino acid stretches plotted for different eukaryotic kingdoms (see legend). Linear regression was calculated for each kingdom (colored dashed lines and legend). Numbers close to the dots correspond to the number of samples for each interval. Intervals with less than five samples were omitted.
