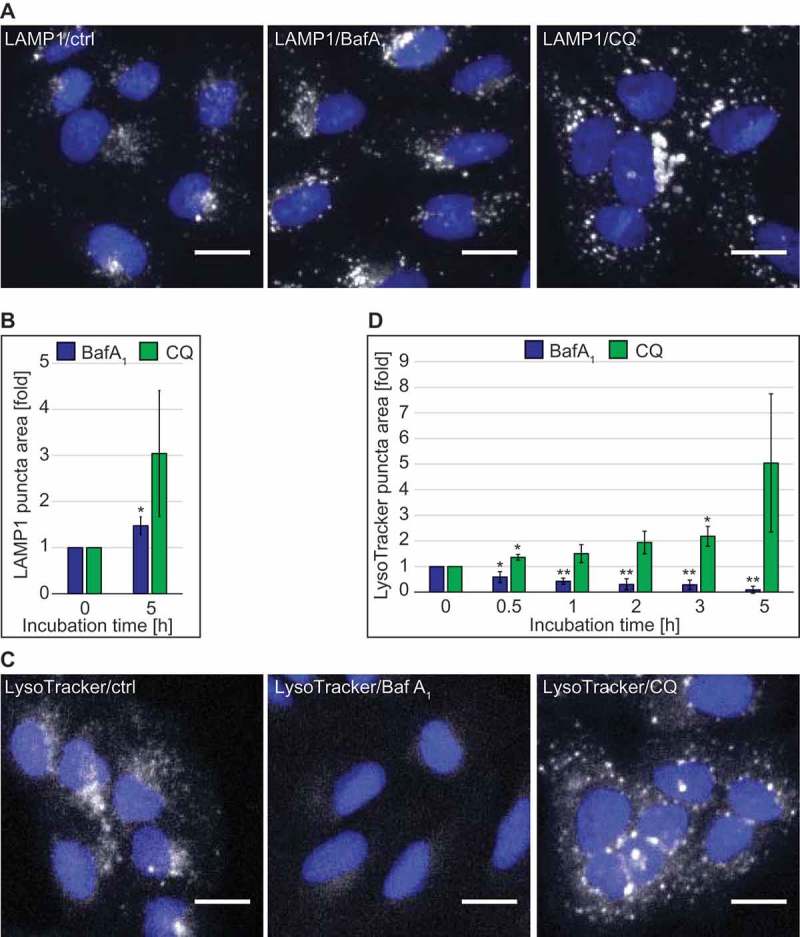
Figure 1.

Quantitative automated fluorescence microscopy analysis revealed significant major differences between BafA1 and CQ treatments on DGCs. U2OS cells were treated with the vector (ctrl/0 h), 100 µM CQ or 100 nM BafA1 for 5 h, or in a time course manner between 0 and 5 h, before processing for immunofluorescence microscopy. Images were acquired and analyzed automatically using the Cellomics Arrayscan. (A) Staining of the preparations with anti-LAMP1 antibodies. (B) Quantification of the LAMP1 puncta area per cell (arbitrary units) from the immunofluorescence images such as for the examples shown in panel A. (C) Cells treated for the indicated times, were incubated with LysoTracker Red for 1 h before being processed for fluorescence microscopy. (D) Quantification of the LAMP1 puncta area per cell (arbitrary units) from images such as the examples depicted in panel C. All data are presented relative to the control at 0 h (fold). Error bars represent standard deviations (SD) of 3 independent experiments. * or ** symbols indicate significant differences of p < 0.05 and p < 0.01, respectively. Scale bars: 20 µm.
