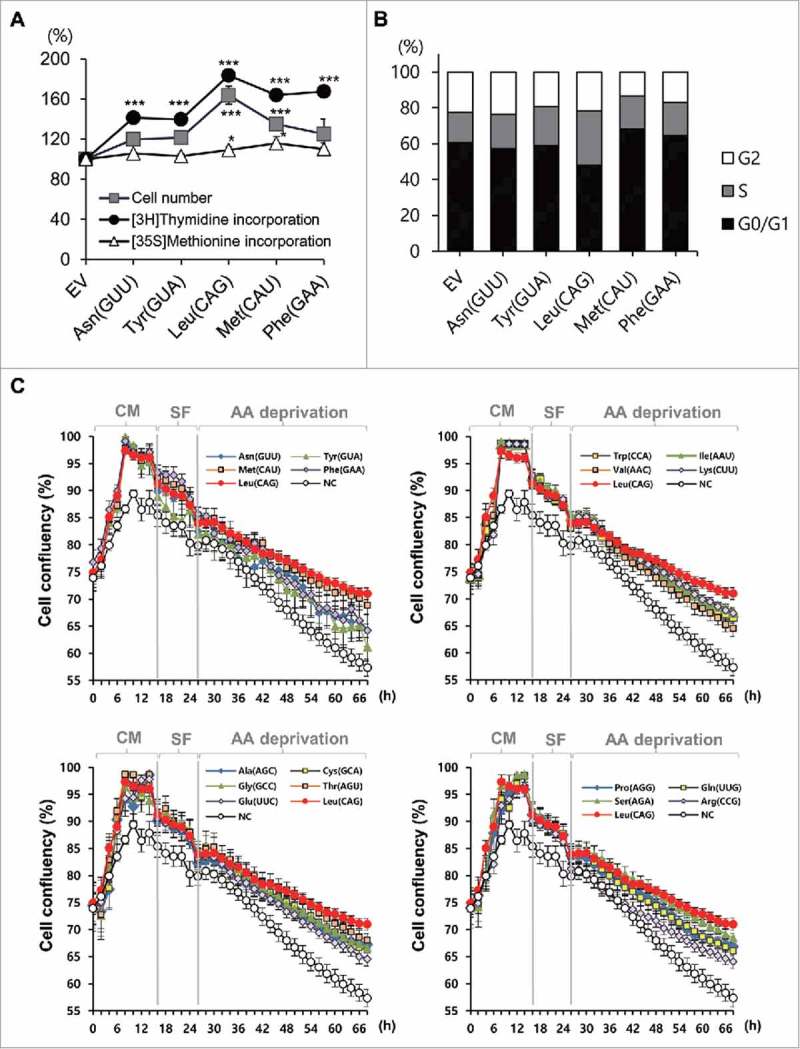
Figure 1.

Overexpression of tRNAs enhanced the cell proliferation. (A) Relative levels (percentage) of cell number, thymidine incorporation, and methionine incorporation after overexpression of each tRNA were compared with those in EV (empty vector)-transfected control. Values are presented as means ± standard deviations (n = 3). *, P < 0.05; ***, P < 0.001. (B) Change in cell cycle after tRNA transfection was compared with that in control. (C) Real-time proliferation of HEK 293T cells transfected with different tRNAs was monitored under different culture conditions. Values are presented as means ± standard errors (n = 9). Values for tRNALeu CAG and negative control (NC) are repeated in all the graphs for the comparison. Cell viability was calculated as the relative percentage of confluency. CM, complete media; SF, serum free; AA, amino acids.
