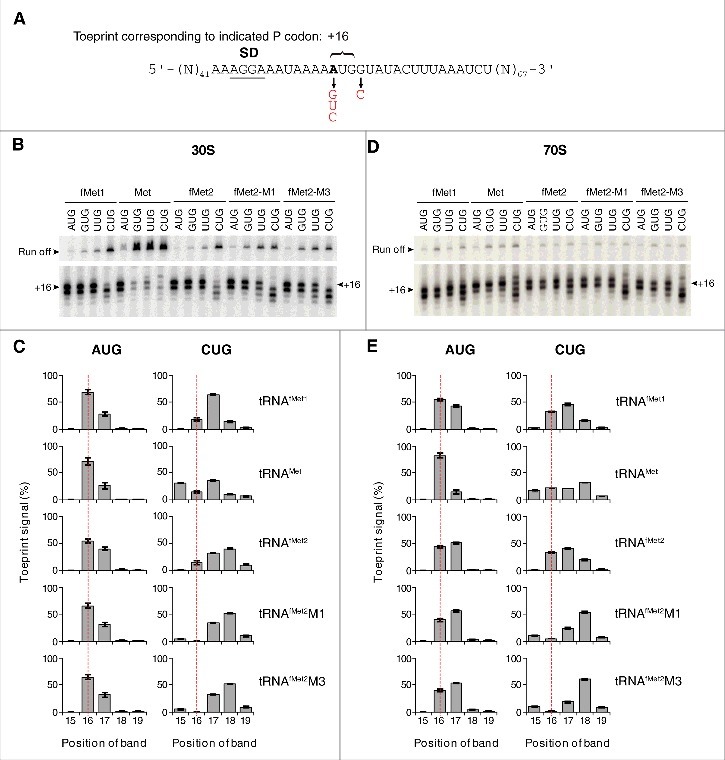
Figure 4.

Positioning of mRNA in various ribosomal complexes. (A) Model mRNAs used in this study. The Shine-Dalgarno element (SD) is underscored and position +1 of the start codon is highlighted in bold text. Various base substitutions made at positions +1 and +4 are shown. 30S (B-C) or 70S (D-E) complexes containing P-site tRNA (as indicated) paired to start codon (as indicated) were analyzed by toeprinting. Complexes were formed in the absence of factors by incubating ribosomes or subunits (1 µM), mRNA (0.01 µM, with preannealed radiolabeled primer), and tRNA (1.5 µM) for 2 h at 37°C, prior to primer extension analysis. Top gel panels show the relative intensities of the full-length cDNA products (Run off). Bottom gel panels show the toeprint bands, with +16 indicated. Histograms show the distribution of toeprint signal versus toeprint position for each 30S (C) and 70S (E) complex. Data were quantified for each complex as (specific toeprint / all toeprints) ×100% and correspond to the mean ± SEM from ≥ 3 independent experiments. The dotted red line benchmarks position +16.
