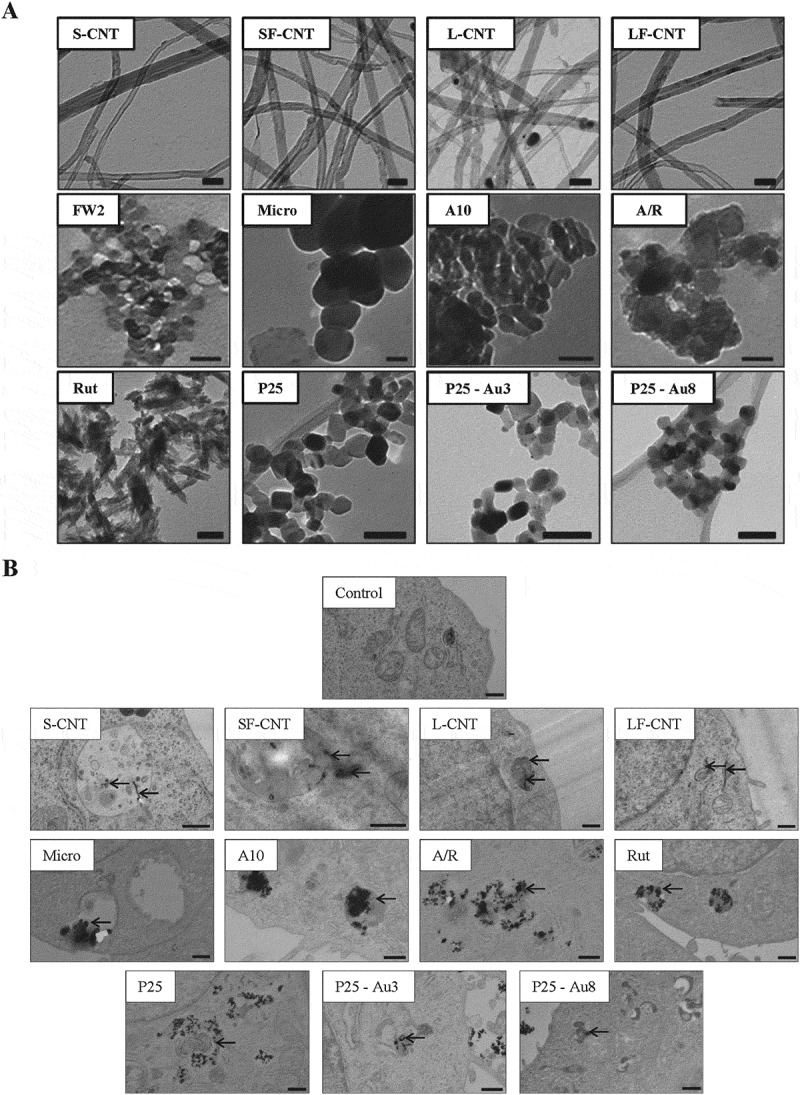
Figure 1.

Transmission electron microscopy (TEM) images of particles and macrophages exposed to particles. (a) TEM images of the particles. Scale bar: 50 nm. (b) TEM images of RAW 264.7 macrophages exposed to 50 µg/mL of particles for 6 h. Scale bar: 500 nm. Black arrows point towards particles.
