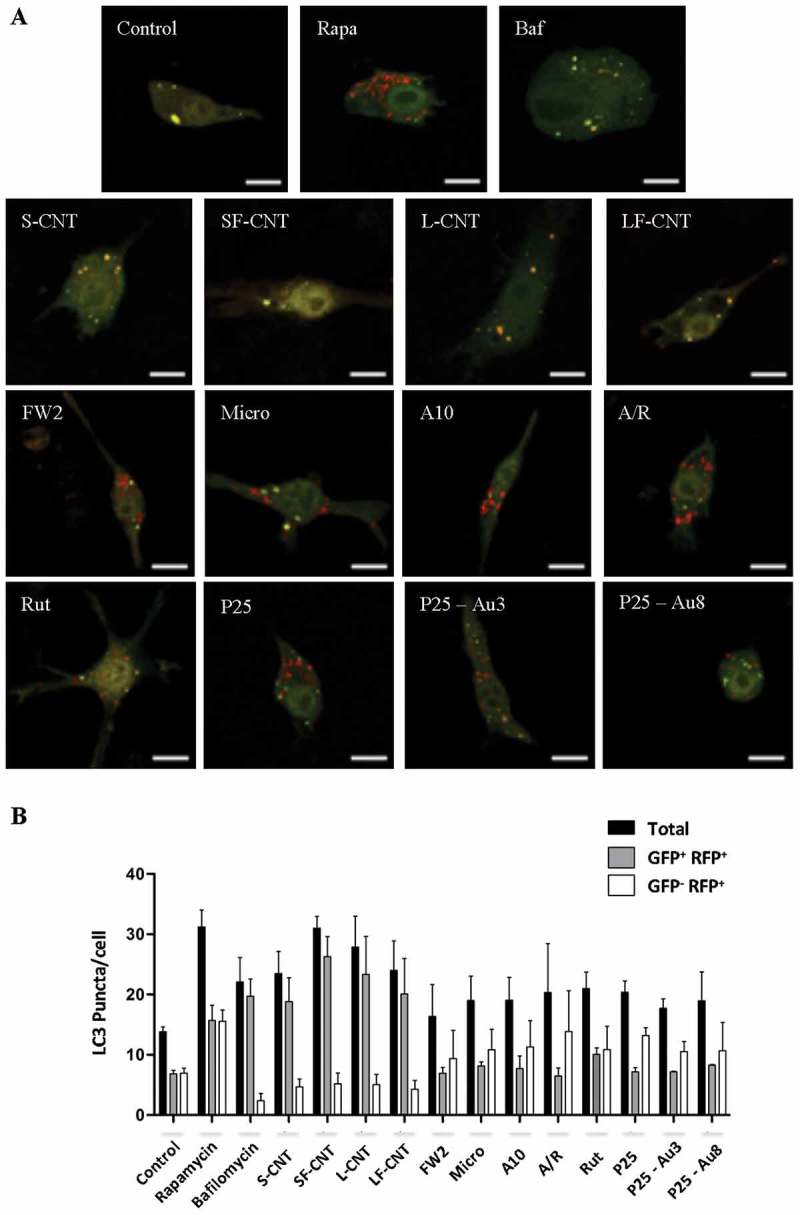
Figure 3.

Quantification of autophagy flux. (a) Confocal images of the transfected mRFP-GFP-LC3 plasmid in RAW 264.7 macrophages exposed to 10 µg/mL of particles for 6 h. Scale bar: 10 µm. Yellow puncta: autophagosomes; red puncta: autolysosomes. (b) Quantification of autophagosome and autolysosome number per cell in each condition. More than 30 cells were counted in each condition. Data are given as mean ± SEM. *, p < 0.05 versus control condition. Baf, Baf-A1 (100 nM); Rapa, rapamycin (100 nM).
