
Figure 6.
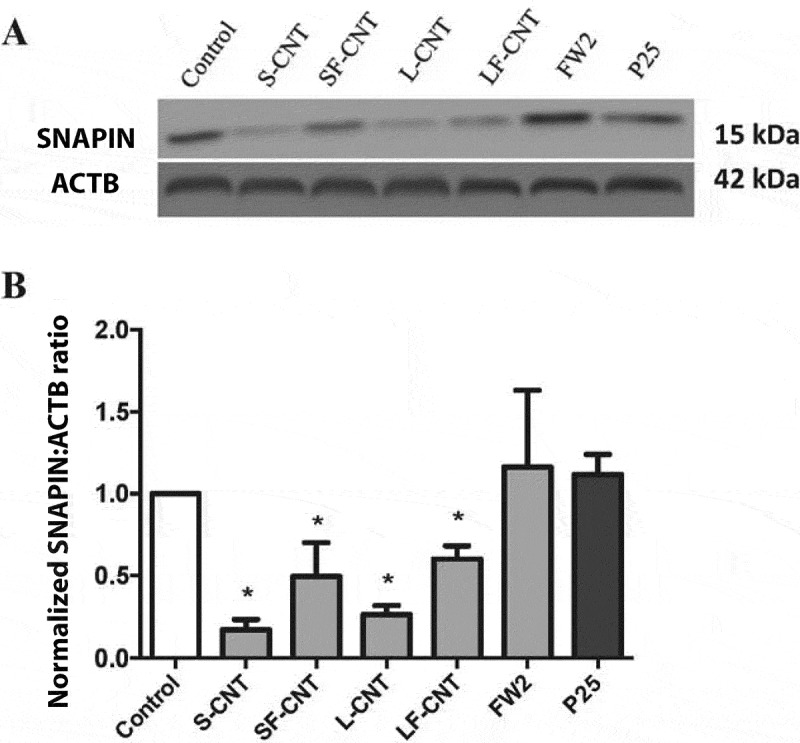
Quantification of SNAPIN expression. (a) Representative western blot images of SNAPIN in RAW 264.7 macrophages exposed to 50 µg/mL of particles for 6 h. ACTB was used as a loading control. (b) Quantification of protein expression levels for SNAPIN. Data are given as mean ± SEM. *: p < 0.05 versus control condition.