
Figure 1.
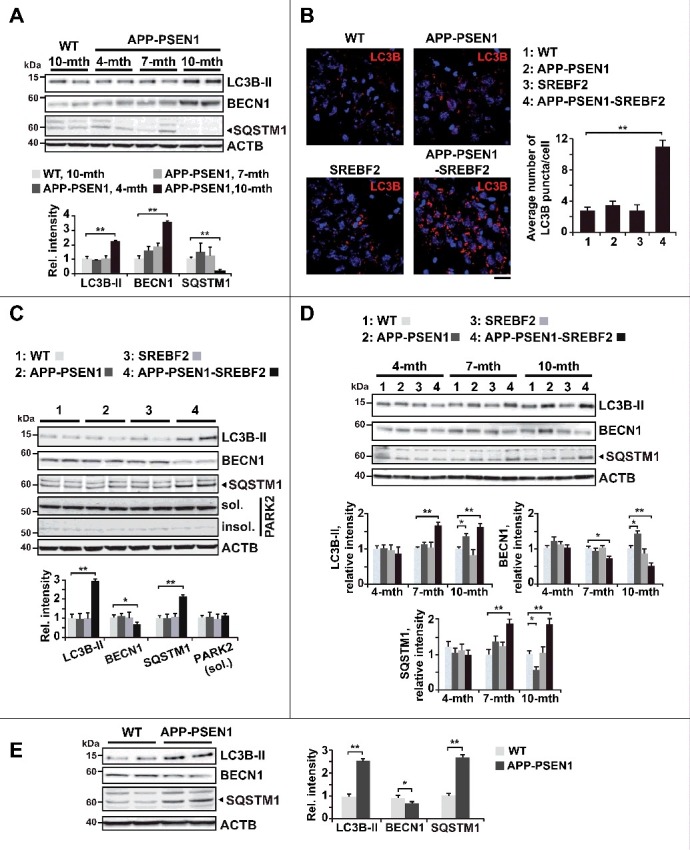
APP-PSEN1 mice overexpressing SREBF2 show an early accumulation of autophagosomes associated with decreased levels of BECN1 and impaired SQSTM1 clearance. Equal amounts of lysates from ML fractions (for LC3 analysis) or brain homogenates were subjected to SDS-PAGE and western blot analysis with the corresponding antibodies. (A) Representative immunoblots showing levels of lipidated LC3B (LC3B-II), BECN1 and SQSTM1 in brains from 10-mo-old WT mice and APP-PSEN1 mice at the indicated ages (mth, month). (B) Representative photomicrographs of hippocampus from 7-mo-old mice labeled with anti-LC3B and counterstained with DRAQ5 (blue) showing increased presence of LC3B puncta in APP-PSEN1-SREBF2 mice. Scale bar: 50 µm. Graph depicts quantification of the average number of LC3B puncta per cell (40 to 50 cells analyzed per genotype from a pool of at least 4 images). (C and D) Immunoblots of lipidated LC3B (LC3B-II), BECN1, SQSTM1, and PARK2 in soluble (sol., detergent-treated) and insoluble (insol., urea-treated) protein fractions of brains from 7-mo-old mice (C), and from mice at the indicated ages (mth, month) (D). (E) Western blot analysis of lipidated LC3B (LC3B-II), BECN1, and SQSTM1 in brains from 15-mo-old WT and APP-PSEN1 mice. In western blot analyses, densitometric values of the bands representing the specific protein immunoreactivity were normalized with the values of the corresponding ACTB/actin β bands and expressed as relative intensity values. *P< 0.05 and **P< 0.01; n≥3. See Figure S15 for uncropped blots.