
Figure 3.
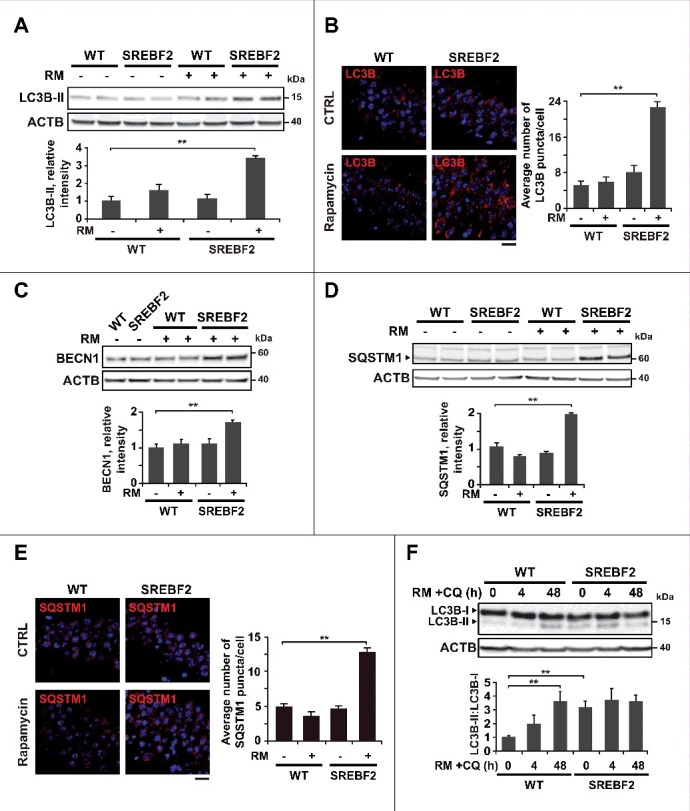
Impaired autophagic flux in SREBF2 mice after in vivo treatment with rapamycin. 7-mo-old WT and SREBF2 mice were treated with the MTOR inhibitor rapamycin (RM) at 5 mg/kg for 24 h. Equal amounts of lysates from ML fractions (for LC3 analysis) or brain homogenates were subjected to SDS-PAGE and western blot analysis with the corresponding antibodies. (A) Representative immunoblots showing levels of lipidated LC3B (LC3B-II). (B) Representative photomicrographs of hippocampus from WT and SREBF2 mice labeled with anti-LC3B and counterstained with DRAQ5 (blue). Scale bar: 50 μm. Graph depicts quantification of the average number of LC3B puncta per cell (80 to 90 cells analyzed per genotype and experimental condition from a pool of at least 4 images). (C and D) Western blot analysis of BECN1 (C), and SQSTM1 (D). (E) Representative photomicrographs of hippocampus from WT and SREBF2 mice labeled with anti-SQSTM1 and counterstained with DRAQ5 (blue). Scale bar: 50 μm. Graph depicts quantification of the average number of SQSTM1 puncta per cell (80 to 90 cells analyzed per genotype and experimental condition from a pool of at least 4 images). (F) To assess changes in autophagic flux mice were cotreated with rapamycin (RM, 5 mg/kg) and chloroquine (CQ, 50 mg/kg) for the indicated times. A representative western blot for LC3B and the corresponding quantification of the LC3B-II:LC3B-I ratio in total brain homogenates are shown. In all western blot analyses, densitometric values of the bands representing the specific protein immunoreactivity were normalized with the values of the corresponding ACTB bands and expressed as relative intensity values. **P< 0.01; n≥3. See Figure S16 for uncropped blots.