
Figure 8.
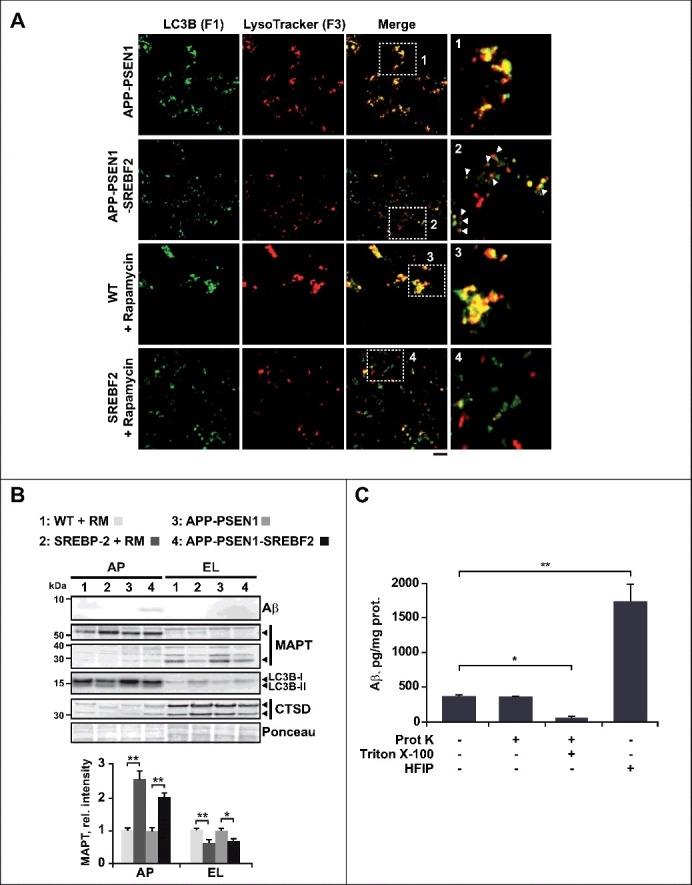
APP-PSEN1 mice overexpressing SREBF2 show impaired autophagosome and endosome-lysosome fusion associated with an accumulation of Aβ and endogenous MAPT in autophagosomes. (A) Autophagosomes (F1) immunolabeled with anti-LC3B antibody and lysosomes (F3) stained with LysoTracker Red were incubated together and fusion events were monitored by immunofluorescence microscopy. Insets show a 3-fold magnification. In inset 2, differentially labeled vesicles in close proximity are indicated by white arrows. Scale bar: 50 μm. (B) Expression levels of Aβ and MAPT in autophagosomes (AP) and endosomes-lysosomes (EL). LC3B and CTSD (intermediate, 45 kDa; and mature form, 34 kDa) were used as markers of AP and lysosomes, respectively. All densitometric values were first normalized to Ponceau S staining to adjust for protein loading. MAPT values were normalized to the corresponding LC3B (I and II) and CTSD (mature form) bands. *P< 0.05 and **P< 0.01; n=3. (C) Proteinase K protection assay. Autophagosomes from APP-PSEN1-SREBF2 mice were exposed to proteinase K (Prot K) with or without Triton X-100 for 30 min. After inhibition of protease activity, levels of Aβ were quantified. To evaluate the presence of Aβ aggregates the same autophagosomal fraction was incubated with HFIP. Disruption of the aggregated forms significantly increased Aβ values, presumably by favoring antibody recognition. *P< 0.05 and **P< 0.01; n=3.