
Figure 9.
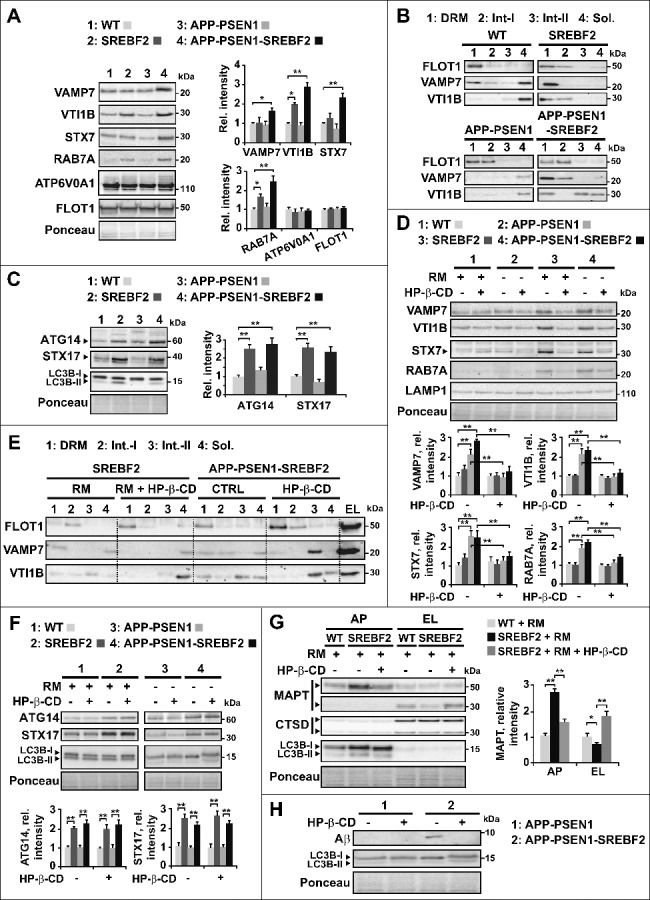
Changes in levels and membrane distribution of key autophagosome and endosome-lysosome fusion proteins in mice overexpressing SREBF2 are prevented by in vivo treatment with 2-hydroxypropyl-β-cyclodextrin resulting in improved MAPT and Aβ clearance. (A) Western blot analysis of the indicated proteins in endosomes-lysosomes isolated from 7-mo-old WT and transgenic mice. (B) Immunoblot analysis of VAMP7 and VTI1B distribution into soluble fractions and DRMs isolated from endosomes-lysosomes of 7-mo-old WT and the indicated transgenic mice. Immunoblots with FLOT1 identified DRMs mainly in fractions 1 and 2. Int-I and Int-II: intermediate fraction I and II, Sol.: soluble fraction. (C) Expression levels of ATG14 and STX17 in autophagosomes isolated from 7-mo-old WT and the indicated mutant mice. To induce autophagy WT and SREBF2 mice were treated with rapamycin (RM, 5 mg/kg) for 24 h. LC3B protein levels were analyzed as a marker of autophagosomes. ATG14 and STX17 were normalized to the corresponding LC3B (I and II) bands. (D to H) Mice were treatment with HP-β-CD (4 g/kg) for 10 wk. To induce autophagy WT and SREBF2 mice were treated with rapamycin (RM, 5 mg/kg) 24 h prior sacrifice. (D) Expression levels of RAB7A and the indicated SNARE proteins in endosomes-lysosomes. LAMP1 was used as a marker of lysosomes. Densitometric values of the bands representing the specific protein immunoreactivity were normalized with the values of the corresponding LAMP1 bands. (E) Immunoblot analysis of VAMP7 and VTI1B distribution into soluble fractions and DRMs isolated from endosomes-lysosomes (EL). Immunoblots with FLOT1 identified DRMs mainly in fractions 1 and 2. Int-I and Int-II: intermediate fractions I and II, Sol.: soluble fraction. (F) Expression levels of ATG14 and STX17 in autophagosomes. LC3B was used as a marker of autophagosomes. ATG14 and STX17 were normalized to the corresponding LC3B (I and II) bands. (G) Expression levels of endogenous MAPT in autophagosomes (AP) and endosomes-lysosomes (EL). LC3B and CTSD (intermediate, 45 kDa; and mature form, 34 kDa) levels were used as autophagosome and lysosome markers, respectively. MAPT values were normalized to the corresponding LC3B (I and II) and CTSD (mature form) bands. (H) Representative immunoblot showing that HP-β-CD treatment prevents the accumulation of Aβ in autophagosomes isolated from APP-PSEN1-SREBF2 mice. In all western blots, densitometric values of the bands representing specific protein immunoreactivity were first normalized to Ponceau S staining to adjust for protein loading. *P< 0.05 and **P< 0.01; n=3. See Figure S18 for uncropped blots.