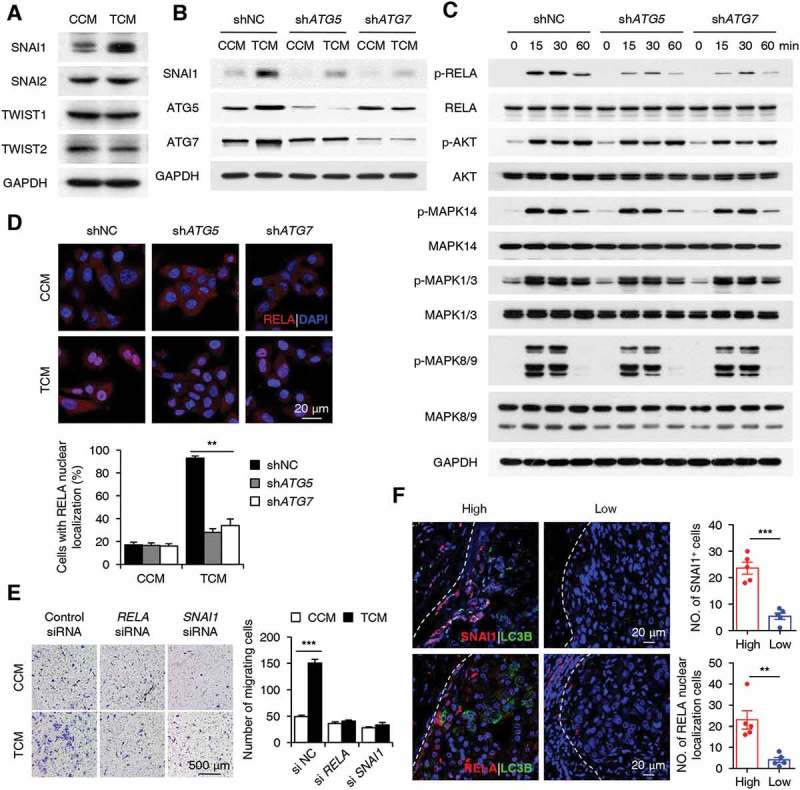
Figure 6.

The NFKB-SNAI1 pathway mediates the autophagy-enhanced migration of cancer cells. (a) HepG2 cells were stimulated with CCM or TCM for 20 h. The expression levels of SNAI1, SNAI2, TWIST1, and TWIST2 were measured by western blotting. (b-d) HepG2 cells were transfected with shNC, shATG5, or shATG7 lentiviral vectors and then treated with CCM or TCM for 20 h (b), 30 min (d), or other time intervals (c). The levels of SNAI1, ATG5, ATG7, p-RELA, RELA, p-AKT, AKT, p-MAPK14, MAPK14, p-MAPK1/3, MAPK1/3, p-MAPK8/9, and MAPK8/9 were determined by western blotting (b and c). Translocation of the RELA protein was analyzed by confocal microscopy (n = 5) (d). (e) HepG2 cells were transfected with control, si-RELA, or si-SNAI1 RNAs before being exposed to CCM or TCM for 20 h, and then their migration abilities were analyzed (n = 6). (f) Sections of hepatoma samples were double stained with anti-human LC3B (green) and anti-human SNAI1 (red) Abs or anti-human LC3B (green) and anti-human RELA (red) Abs. The levels of SNAI1 and nuclear-located RELA expression at the invading edge of human HCCs with high or low LC3B expression were determined by confocal microscopy. Blue, DAPI; n = 5. One out of 5 representative graphs is shown in A-F. The results shown in D, E and F are expressed as the means ± SEM. ** P < 0.01, *** P < 0.001.
