. 2018 Aug 21;7:e37815. doi: 10.7554/eLife.37815

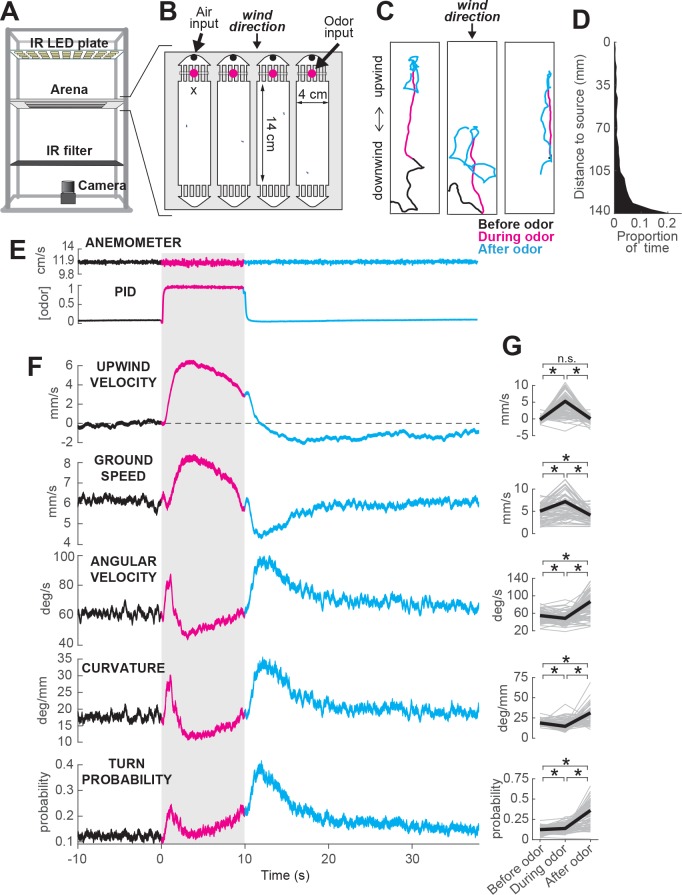
Figure 1. ON and OFF responses to an attractive odor pulse.

(A) Schematic of the behavioral apparatus (side view) showing illumination and imaging camera. (B) Schematic of the behavioral arena (top view) showing four behavior chambers and spaces to direct air and odor through the apparatus. Dots mark air and odor inputs. Black cross: site of wind and odor measurements in E. (C) Example trajectories of three different flies before (black), during (magenta) and after (cyan) a 10 s odor pulse showing upwind runs during odor and search after odor offset. (D) Distribution of fly positions on trials with wind and no odor; flies prefer the downwind end of the arena. (E) Average time courses of wind (top; anemometer measurement; n = 10) and odor (bottom; PID measurement normalized to maximal concentration; n = 10) during 10 s odor trials. Measurements were made using 10% ethanol at the arena position shown in B. (F) Calculated parameters of fly movement averaged across flies (mean±SEM; n = 75 flies, 1306 trials; see Materials and methods). Traces are color coded as in C. Gray-shaded area: odor stimulation period (ACV 10%). All traces warped to estimated time of odor encounter and loss prior to averaging. Small deflections in ground speed near the time of odor onset and offset represent a brief stop response to the click of the odor valves (see Figure 3—figure supplement 1). (G) Average values of motor parameters in F for each fly for periods before (−30 to 0 s), during (2 to 3 s) and after (11 to 13 s) the odor. Gray lines: data from individual flies. Black lines: group average. Horizontal lines with asterisk: Statistically significant changes in a Wilcoxon signed rank paired test after correction for multiple comparisons using the Bonferroni method (see Materials and methods for p values). n.s.: not significant.

Figure 1.

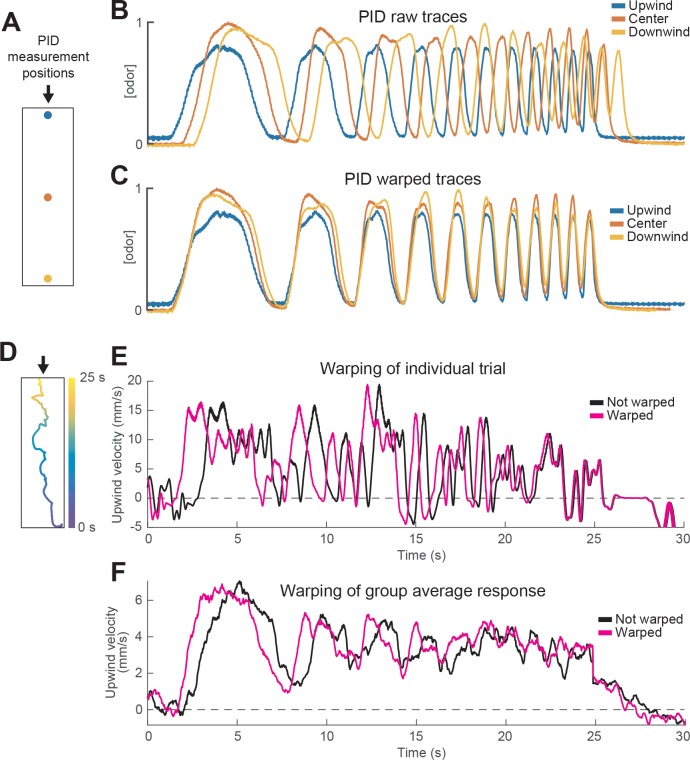
Figure 1—figure supplement 1. Warping method corrects for differences in odor encounter timing as a function of position within the arena.

Figure 1—figure supplement 1.

(A) Schematic of the behavioral arena marking different points at which we measured the odor waveform by PID. Arrow signals wind direction. (B) PID measurements of an upward frequency sweep stimulus recorded at the three points in A using 10% ethanol. Note the delay between the stimulus measured at the source (blue) and the one measured at the bottom of the arena (yellow). (C) Same PID traces as in B after warping traces measured downwind of the source (red and yellow). Note the overlap between the three traces in each phase of the stimulus. (D) Trajectory of a fly in a single trial while experiencing the stimulus depicted in C. Time in the stimulus (0–25 s) is color coded, showing that the fly moved from the bottom of the arena to the top during the stimulus. (E) Upwind velocity of the fly in the example trial shown in D. Black trace represents raw upwind velocity. Magenta trace shows data after warping. Note that warping reduces the apparent latency of the first behavioral response, and that the difference between the traces decreases as the fly approaches the odor source F) Same as E, but traces represent the mean upwind velocity of a group of flies in response to the same stimulus (n = 31 flies, 346 trials; data in Figure 3E). Note that warping improves the phasic structure in the data.
Figure 1—figure supplement 2. Variability between individuals in responses to an odor pulse.
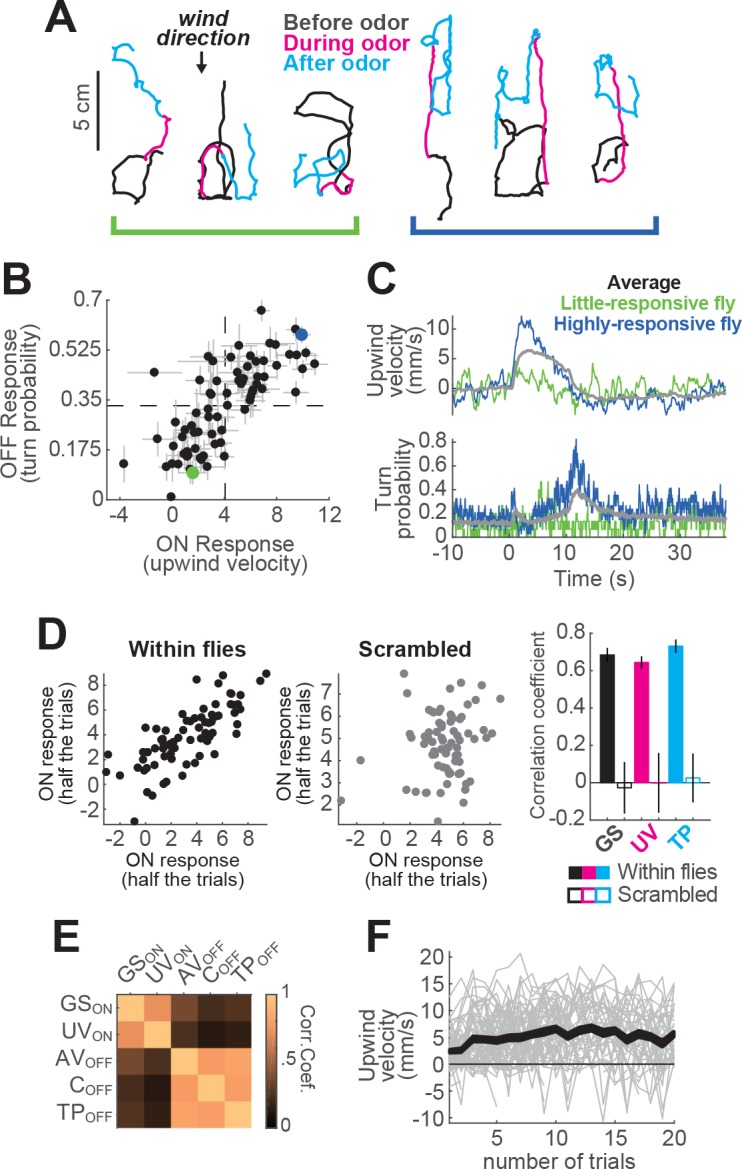
Figure 1—figure supplement 2.

(A) Example trajectories from two different flies (left and right groups), from non-consecutive trials, in response to a 10 s odor pulse. Left hand fly: weak searcher, right-hand fly: strong searcher. (B) Mean upwind velocity during odor (2 to 3 s) and turn probability after odor (11 to 13 s) for each fly (n = 75 flies; data in Figure 1). Each point represents the average of a single fly (mean±SEM). Dashed lines: group average values for ON and OFF responses. Green and blue dots: weak- and strong-searching flies featured in panels A and C. Data from these flies is used in Figure 5J and K. (C) Average upwind velocity and turn probability of weak- and strong-searching flies in B, and of the whole group (gray traces; n = 75 flies, 1306 trials), in response to a 10 s odor pulse. (D) Flies exhibit characteristic search strengths. Left plot: upwind velocity for each fly on half of trials versus upwind velocity in remaining trials (n = 75 flies; trials for each half were randomly selected). Each point represents mean upwind velocity 2–3 s after odor onset for each fly in Figure 1. Middle plot: same analysis performed on trials where fly identity was scrambled. Right plot: Quantification of correlations for upwind velocity during odor, ground speed before odor, and turn probability at offset. Each bar shows the correlation coefficient (mean±STD) from 10 repetitions of the corresponding correlation, either with fly identity preserved (filled bars), or scrambling the data (blank bars). Ground speed (GS) was taken from −30 to 0 s before odor. Upwind velocity (UV) was taken from 2 to 3 s during odor. Turn probability (TP) was taken from 1 to 3 s after odor. (E) Trial-by-trial correlation coefficients between movement parameters (computed for each fly, then averaged across flies; n = 75 flies). ON parameters are correlated with each other, as are OFF parameters, but ON and OFF are not correlated with each other. This suggests that ON and OFF responses are separately regulated on a trial by trial basis. GSON: Mean ground speed from 2 to 3 s during odor. UVON: Mean upwind velocity from 2 to 3 s during odor. AVOFF: Mean angular velocity from 1 to 3 s after odor. COFF: Mean curvature from 1 to 3 s after odor. TPOFF: Mean turn probability from 1 to 3 s after odor. (F) Mean upwind velocity from 2 to 3 s during odor for each trial of every fly in Figure 1 in which the stimulus was a 10 s odor pulse, represented in chronological order along the X axis. Gray lines: data from individual flies. Black traces: Area between SEM errors.
Figure 1—figure supplement 3. Sighted flies show ON and OFF responses to odor.

Figure 1—figure supplement 3.

(A) Calculated parameters of fly movement averaged across flies (mean±SEM). Black traces represent responses of blind flies w1118 5905 norpA (Kennedy, 1940) (same data as in Figure 1F; n = 75 flies, 1306 trials). Orange traces are responses of sighted flies w1118 5905 (n = 56 flies, 1155 trials; see Materials and methods). Gray-shaded area: odor stimulation period (ACV 10%). All traces warped to estimated time of odor encounter and loss prior to averaging. Small deflections in ground speed near the time of odor onset and offset represent a brief stop response to the click of the odor valves (see Figure 3—figure supplement 1E). (B) Average values of motor parameters in A for each fly for periods before (−30 to 0 s), during (2 to 3 s) and after (11 to 13 s) the odor. Gray lines: data from individual flies. Orange thicker lines: group average. Horizontal lines with asterisk: Statistically significant changes in a Wilcoxon signed rank paired test after correction for multiple comparisons using the Bonferroni method (see Materials and methods for p values). n.s.: not significant.