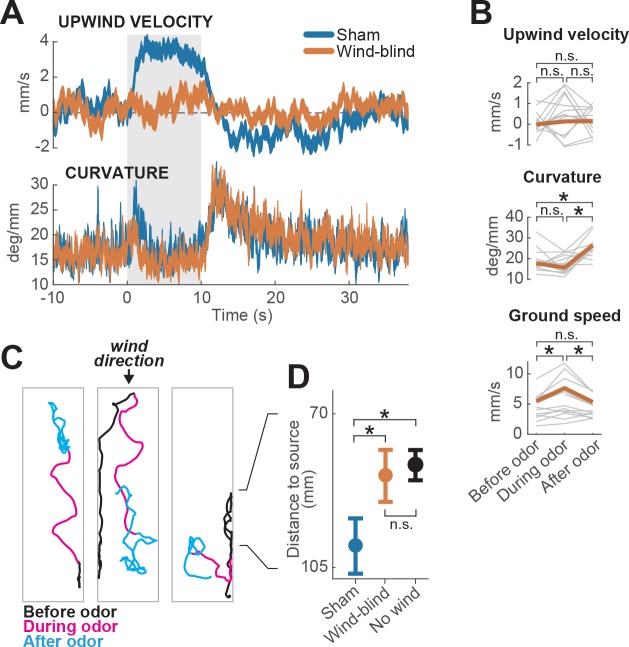
Figure 2. Multimodal and unimodal contributions to olfactory behavior.
(A) Stabilization of the antennae abolishes odor-evoked changes in upwind velocity but not curvature. Traces show meanSEM for wind-blind (n = 13 flies, 240 trials) and sham-treated flies (n = 15 flies, 217 trials; see Materials and methods) (B) Mean values of upwind velocity, curvature and ground speed in wind-blind flies during periods before, during, and after the odor pulse (time windows as in Figure 1G). Gray lines: data from individual wind-blind flies. Orange lines: group average. Horizontal lines with asterisk: statistically significant changes in a Wilcoxon signed rank paired test after correction for multiple comparisons using the Bonferroni method (see Materials and methods for p values). n.s.: not significant. (C) Example trajectories of three different wind-blind flies before (black), during (magenta) and after (cyan) the odor pulse. Note different orientations relative to wind during the odor. (D) Antenna stabilization decreases preference for the downwind end of the arena on trials with wind and no odor. Blue: average (SEM) arena position of sham-treated flies on trials with wind and no odor. Orange: average position of wind-blind flies in the same stimulus condition. Black: Average position of intact (not-treated) flies in the absence of both odor and wind (n = 23 flies, 1004 trials). The average arena position of wind-blind flies did not differ significantly from that of no-wind flies (p=0.93). Sham-treated flies spent significantly more time downwind than wind-blind (p=0.04) or intact flies in the absence of wind (p=0.0027). Horizontal lines with asterisk: statistically significant changes in a Wilcoxon rank sum test (alpha = 0.05). n.s.: non-significant. Black lines between C and D provided for reference of dimensions in D.

