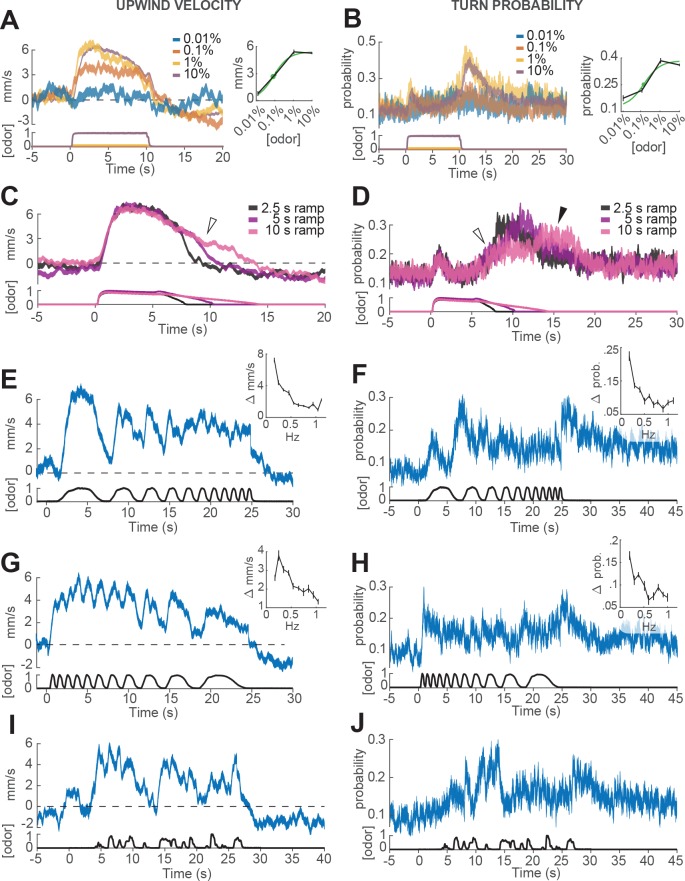
Figure 3. Responses of walking flies to dynamic odor stimuli.
(A) Upwind velocity (left, top traces; averageSEM) of different groups of flies responding to a 10 s pulse of ACV at dilutions of 0.01% (n = 13 flies, 147 trials), 0.1% (n = 19 flies, 304 trials), 1% (n = 18 flies, 302 trials) and 10% (n = 75 flies, 1306 trials). Left-bottom traces show PID measurements using ethanol (max concentration 10%), normalized to maximal amplitude. Right inset: mean upwind velocity during odor (2 to 3 s) as a function of odor concentration (black; meanSEM), and fitted Hill function (green; green dot: =0.072%). (B) Turn probability calculated from the same data. Right inset black traces: mean turn probability after odor (11 to 13 s). =0.127% for fitted Hill function (green). (C) Upwind velocity (averageSEM) in response to stimuli with off-ramps of 2.5 (n = 38 flies, 528 trials), 5 (n = 38 flies, 567 trials) and 10 (n = 35 flies, 557 trials) seconds duration. Bottom traces: PID signals of the same stimuli using ethanol. (D) Same as C, showing turn probability from the same data sets. White arrows in C and D show elevated upwind velocity and turn probability that co-occur during a slow off-ramp. Black arrow in D: peak turn probability response at the foot of the off-ramp. (E) Upwind velocity (meanSEM; n = 31 flies, 346 trials) in response to an ascending frequency sweep stimulus. Bottom trace: PID signal of the stimulus, measured using ethanol. Right inset: average (SEM) modulation of upwind velocity as a function of frequency in each stimulus cycle (see Materials and methods). (F) Same as E for turn probability calculated from the same data. Right inset: modulation of turn probability as a function of frequency. (G) Equivalent to E, showing responses to a descending frequency sweep (n = 33 flies, 345 trials). In the inset, the first high-frequency cycle was left out of the analysis. (H) Same as G for turn probability calculated from the same data. (I) Equivalent to G, showing responses to a simulated ‘plume walk’ (n = 30 flies, 393 trials). (J) Same as I for turn probability calculated from the same data.


