. 2018 Jul 30;7:e37184. doi: 10.7554/eLife.37184

Figure 1. Genome scale ORF screen identifies splicing factors and RNA-binding proteins as regulators of EMT.

(A) Schematic of the genome scale ORF screen used to identify regulators of EMT. (B) Distribution of enrichment Z scores. The red dots indicate the ORFs with a Z score >3 and the top 15 gene names are labeled (Figure 1—source data 1). (C) The top candidate ORFs in the screen categorized into seven different functional classes. (D) Network analysis of enriched protein complexes among the top candidates ORFs. (E) GO term enrichment analysis of the top candidate ORFs. (F) Enrichment for RNA metabolic processes among the top candidate ORFs, as determined by pre-ranked GSEA analysis.

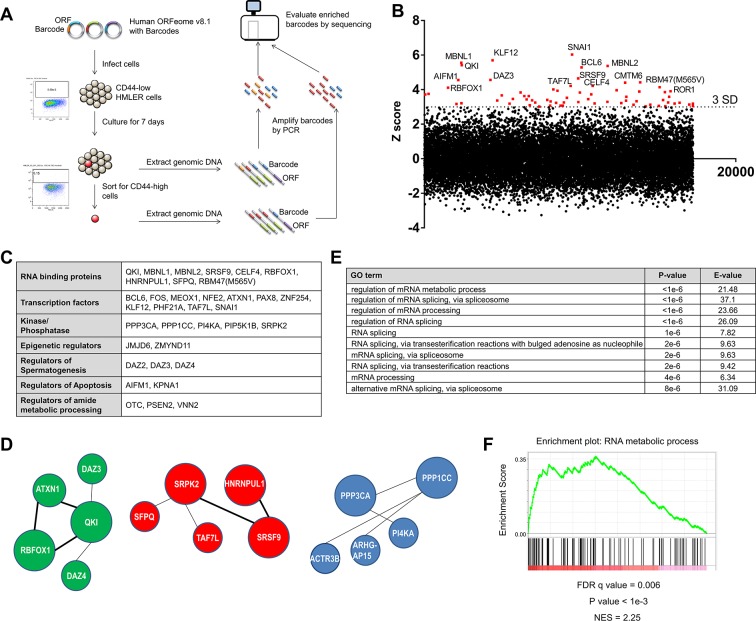
Figure 1—source data 1. ORF screen results.
elife-37184-fig1-data1.xlsx (781.1KB, xlsx)
DOI: 10.7554/eLife.37184.006

Figure 1.

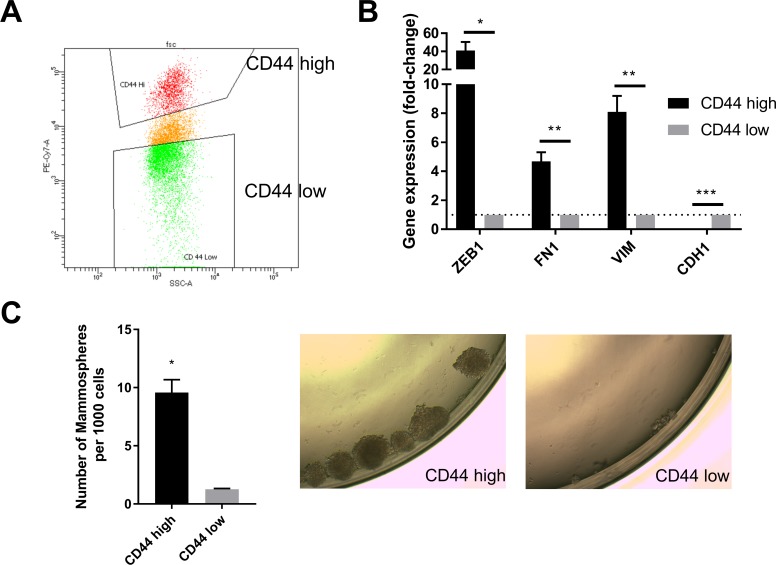
Figure 1—figure supplement 1. CD44 status serves as a marker for the mesenchymal and stem-like cell state in human mammary epithelial cells.

Figure 1—figure supplement 1.

(A) HMLER cells were stained with CD44-PE-CY7 antibody. CD44 high and low cell populations were sorted by flow cytometry. The gating for CD44 high and low cells is shown. (B) qPCR analysis of the expression of mesenchymal (ZEB1, FN1 and VIM) and epithelial (CDH1) markers in CD44 high and low HMLER cells. n = 4. *, p<0.05, **, p<0.01. Student’s two-tailed t test. (C) Left: Quantification of mammosphere numbers derived from 1000 HMLER CD44 high or low cells plated in ultra-low attachment plates. n = 3. *, p<0.05. Student’s two-tailed t test. Right: Representative images of the CD44 high and CD44 low cells.
Figure 1—figure supplement 2. A genome scale ORF screen to identify regulators of EMT.

Figure 1—figure supplement 2.

(A) The reproducibility of the two replicates in the screen. Shown are the comparison of the Log scores of the unsorted cell population (left) or the CD44 high cell population (right) between the two replicates. (B) The Z scores of all the ORFs tested in the screen. The ORFs were sorted from high to low based on their Z score value. The red dots indicate the 68 genes with a Z score greater than 3 (related to Figure 1B).