. 2018 Jul 30;7:e37184. doi: 10.7554/eLife.37184

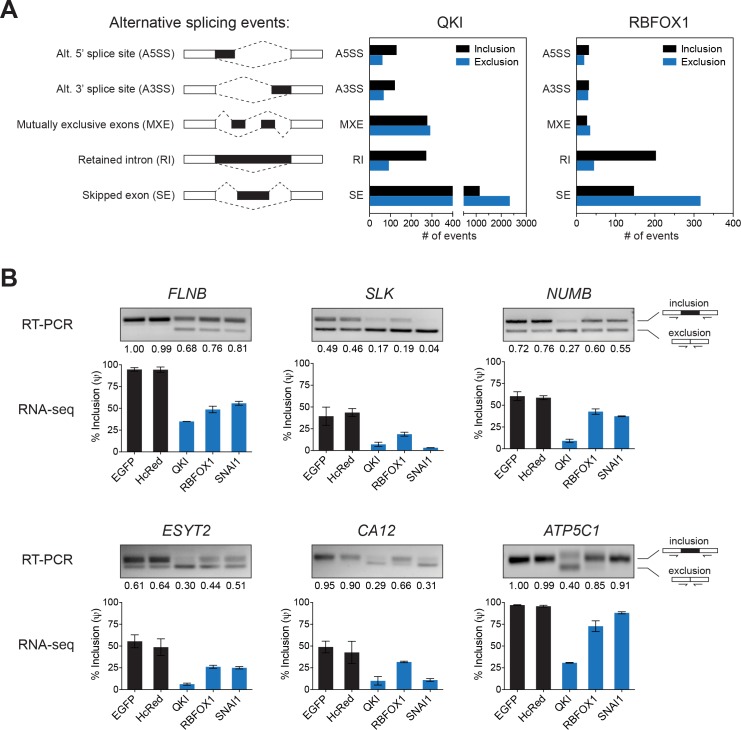
Figure 3. Identification of splicing targets regulated by QKI and RBFOX1.

(A) Quantification of the different types of alternative splicing events regulated by QKI or RBFOX1 overexpression as determined using rMATS. Exclusion or inclusion are relative to control cells overexpressing EGFP. (B) RT-PCR validation of individual splicing events regulated by QKI or RBFOX1. The cDNA from cells expressing the indicated ORFs were subjected to PCR amplification using primers flanking the alternative exon. The ratios of the intensity of the upper (inclusion) and lower (exclusion) PCR product bands were quantified and the relative intensity of the upper band is indicated. Below are shown RNA-sequencing based quantification of the % inclusion of the alternative exon. n = 3 (EGFP, HcRed and RBFOX1) or n = 2 (QKI and SNAI1).

Figure 3—source data 1. QKI rMATS splicing output.
DOI: 10.7554/eLife.37184.014
Figure 3—source data 2. RBFOX1 rMATS splicing output.
DOI: 10.7554/eLife.37184.015

Figure 3.

Figure 3—figure supplement 1. RNA sequencing analysis of HME cells expressing QKI and RBFOX1.

Figure 3—figure supplement 1.

(A) Volcano plots of the change in ‘Percentage Spliced In’, or ∆PSI (x-axis), versus the –log10(p value) (y-axis) for alternatively skipped exons in HME cells expressing hcRED, QKI, RBFOX1 or SNAI1, in comparison to cells expressing EGFP. (B, C) Genes with alternatively skipped exons regulated by QKI (B) or RBFOX1 (C) were analyzed by pre-ranked gene set enrichment analysis (GSEA) and the enriched Geneset pathways and their normalized enrichment scores, P and FDR Q values are shown.