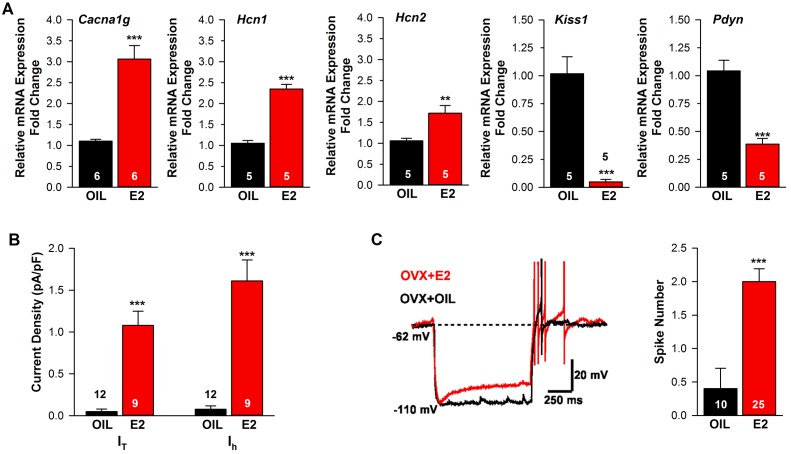
Figure 2. Estradiol regulation of ion channel mRNA expression and excitability of Kiss1ARH Neurons.
(A) Quantitative real-time PCR measurements of Cacna1g (Cav3.1), HCN1, HCN2, Kiss1 and Pdyn mRNAs in Kiss1ARH neuronal pools (3 pools of 5 cells each per animal) from OVX oil- and E2-treated mice (n = 5–6 animals per group). Note that E2 increased the mRNA expression of Cacna1g, Hcn1, Hcn2, but as expected decreased the mRNA expression of Kiss1 and Pdyn in the same Kiss1 neuronal pools (for, Cacna1g, Unpaired t-test t(10) = 6.037, p<0.001; Hcn1, Unpaired t-test, t(8) = 10.13, p<0.0001; Hcn2, Unpaired t-test, t(8) = 3.420, p<0.01; Kiss1, Unpaired t-test, t(8) = 6.348, p<0.001; Pdyn, Unpaired t-test, t(8) = 6.118, p<0.001). (B) T-type calcium current and h-current density (pA/pF) in Kiss1ARH neurons from OVX oil- and E2-treated mice (for T-current, t(19) = 6.956, p<0.0001; for h-current, t(19) = 6.964, p<0.0001; n = 9–12 neurons from 8 animals). Current densities were measured as previously described (Zhang et al., 2013). (C) Example of rebound burst firing in Kiss1ARH neurons (left), which increased fast Na+ spiking with E2, and summary data (right) from oil- versus E2-treated females (n = 10 and 25 neurons, respectively). Rebound firing was measured as previously described (Zhang et al., 2013). Bar graphs represent the mean ±SEM, (Unpaired t-test, t(33) = 4.455, p<0.0001). **p<0.01, ***p<0.001.

