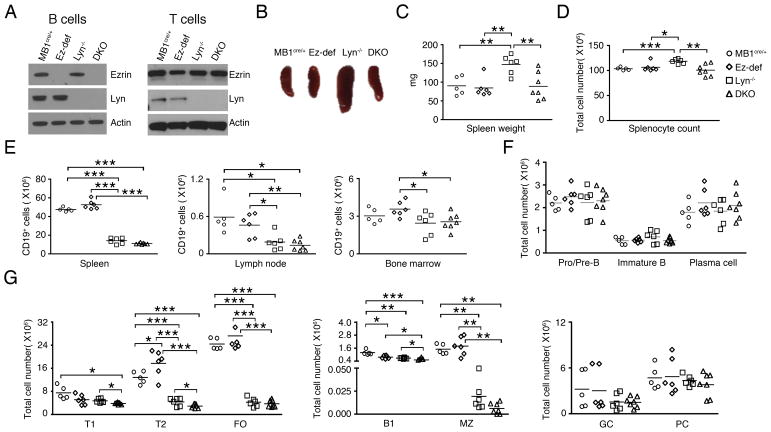
Figure 1. Effects of Lyn and ezrin deficiency on B cell subsets.
(A) Purified splenic B and T cell lysates from MB1cre/+, Ez-def, Lyn−/− and DKO mice were probed for ezrin, Lyn, and actin. (B) Representative photomicrograph of spleens from 2–3 month old MB1cre/+, Ez-def, Lyn−/− and DKO mice. Data are representative of 5–7 mice for each genotype analyzed. Spleen weight (C) and splenocyte count (D) from 2–3 month old mice. (E) Absolute numbers of CD19+ B cells in the spleen, lymph node, and bone marrow from 2–3 month old MB1cre/+, Ez-def, Lyn−/− and DKO mice. Absolute numbers of pro/pre, immature, and plasma cells in the bone marrow (F), and transitional 1 (T1), transitional 2 (T2), follicular (FO), B1, marginal zone (MZ), germinal center cells (GC) and plasma cells (PC) in the spleen (G). Each symbol represents an individual mouse. Data represent mean ± SEM from 5–7 mice per group. (C–G) *p < 0.05, **p < 0.01, ***p < 0.001.

