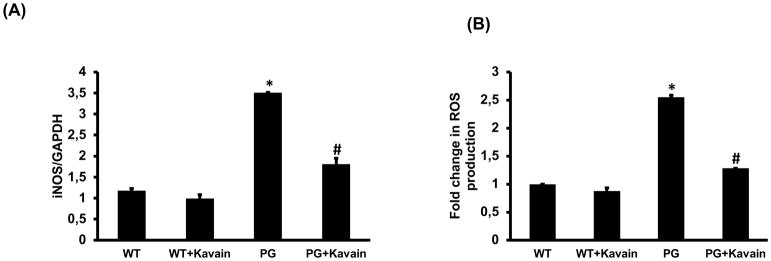
Figure 4.
Effect of Kavain treatment on 3T3-L1 derived adipocytes cells with and without exposure of P. gingivalis. RT-PCR analysis revealed mRNA expression of (A) iNOS, (B) ROS production measured by staining with 2′,7′-dichlorofluorescein diacetate; DCFH-DA, in WT-control, WT+Kavain, P.gingivalis exposed adipocytes and P.gingivalis + Kavain exposed cells. Results are mean±SE, n=3–4, *p<0.05 vs. WT, #p< 0.05 vs. P.gingivalis.

