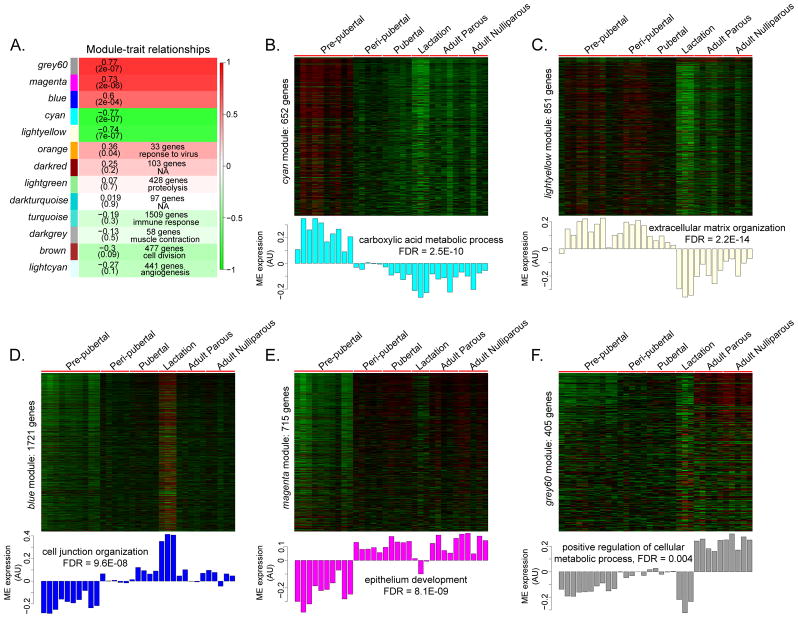
Figure 5. WGCNA of developing mammary glands.
A. Heatmap showing association between modules and developmental groups. Each cell contains the Pearson correlation of the module eigengene (ME) (the first principal component of genes in a module) with developmental stage and p-values are indicated in brackets. For non-significant modules, number of genes within the module and where applicable, top GO term is indicated in the corresponding cell. Red corresponds to modules that contain genes whose expression increases during mammary gland development and green corresponds to modules containing genes with decreasing expression during development; color intensity is proportional to the strength of the correlation. B–F. Heatmaps and corresponding ME profile of significant modules. Genes are in rows, samples in columns. Top GO enrichment result for each module and associated FDR are indicated. AU: Arbitrary units.

