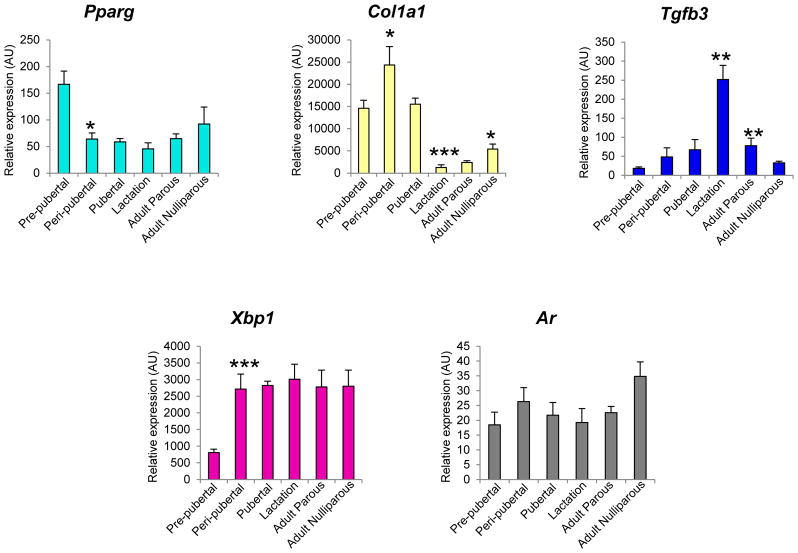
Figure 7. Module hub genes validated by qPCR.
One hub gene per module was selected for validation by qPCR. cyan module: Ppar-gamma, lightyellow module: Col1a1, blue module: Tgfb3, magenta module: Xbp1, grey60 module: Ar. Bars represent mean ± standard error. Statistical differences between adjacent developmental stages were determined using t-test; *indicates p<0.05, **p<0.01 and ***p<0.0005. AU: Arbitrary units.

