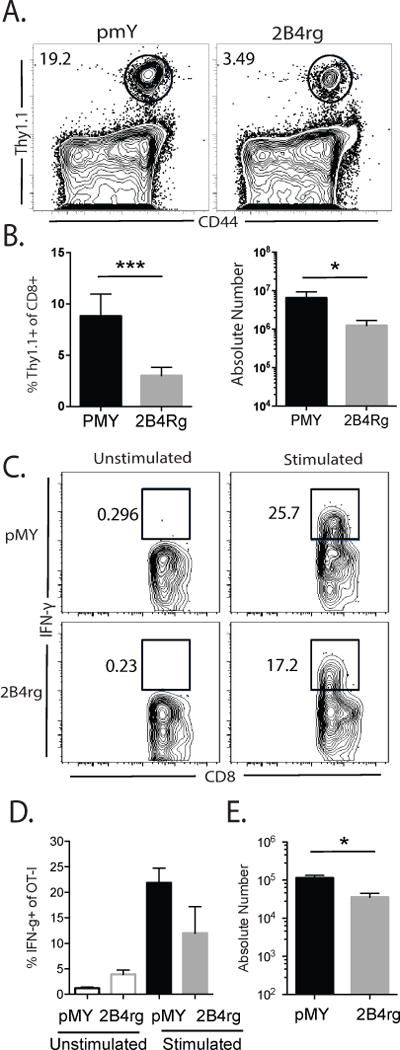
Figure 2. Ectopic expression of 2B4 results in reduced accumulation of antigen-specific CD8+ T cells but does not impact function of antigen-specific CD8+ T cells on a per cell basis.

A, Representative flow cytometry plots gated on CD8+ cells isolated from the spleen. B, Frequencies and absolute numbers of CD44hi Thy1.1+ of CD8+ cells. C, IFN-γ+ pMY or 2B4rg cells following ex vivo stimulation with PMA and ionomycin. D, Summary of the frequency of IFN-γ-producing Thy1.1+ CD8+ T cells, representative of 2 independent experiments with 7-8 mice/group. E, Summary of the absolute numbers of IFN-γ-producing Thy1.1+ CD8+ T cells, representative of 2-3 independent experiments with 7-12 mice/group. *p<0.05, ** p<0.001, *** p<0.0001.
