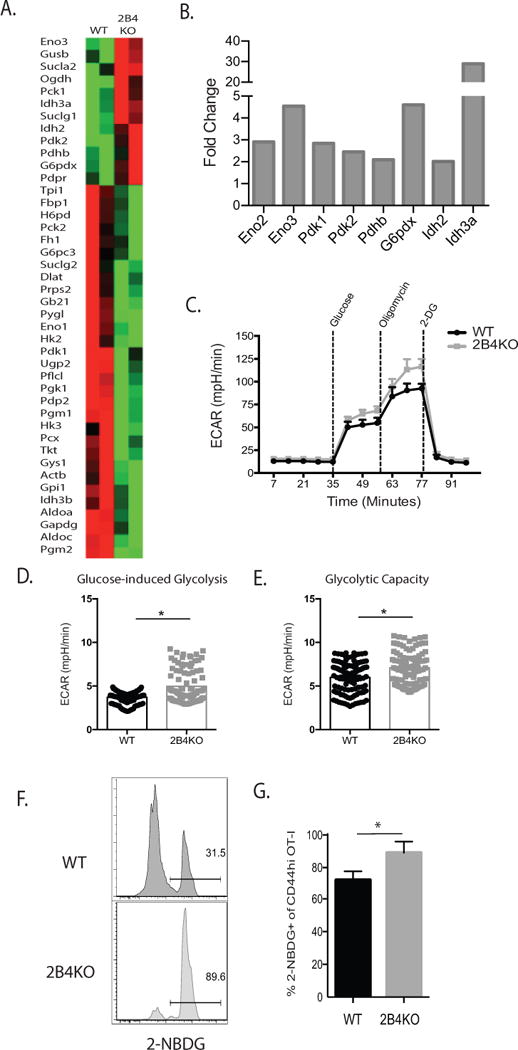
Figure 5. 2B4 signaling limits glycolytic capacity of CD8+ T cells.

A, cDNA was synthesized from 400 ng of RNA isolated from 2B4+ WT or 2B4KO OT-I T cells following in vitro activation (7d) and restimulation (4d) and subsequently used to assess changes in glycolytic metabolism between 2B4+ and 2B4KO cells via the Qiagen Glucose Metabolism RT2 Profiler PCR Array. Representative of 2 independent experiments with a total of 6-8 mice per group. B, Summary derived from the data set described above in A of selected genes that were increased over baseline in OT-I T cells in the absence of 2B4. C, 3×10⁶ WT or 2B4KO OT-I T cells were stimulated with 1nM SIINFEKL for 4 d. 2×10⁵ OT-I Ficoll-purified cells were then plated as described in Supplemental Methods. D-E, Rate of ECAR during glucose-induced glycolysis was averaged from three measurements following the addition of glucose, while glycolytic capacity was calculated from the average of three measurements following the addition of oligomycin. C-E are representative of two experiments, p < 0.0001. F, 104 WT or 2B4KO OT-I T cells were transferred into naïve B6 hosts and infected with 104 CFU of LM-OVA two days later. After 14 days, recipients were sacrificed, splenocytes were prepared as a single-cell suspension, washed with PBS, and then incubated with 2-NBDG ex vivo and analyzed via flow cytometry. G, Summary of expression of 2-NBDG as gated in part F. p = 0.01. F-G are representative of 4-5 mice/group.
