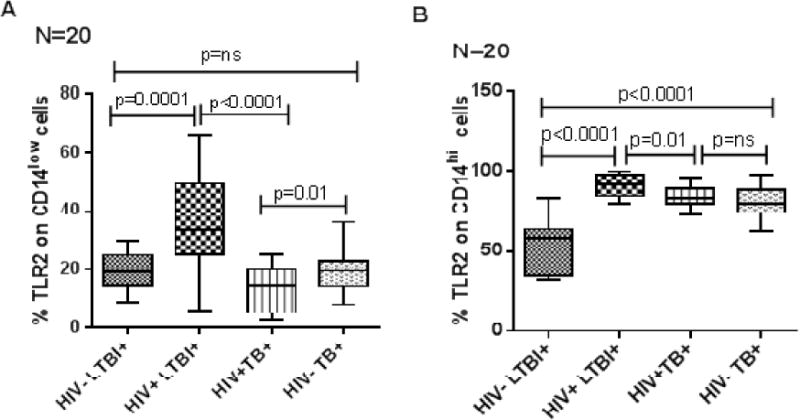
Figure 2. TLR2 expression by CD14low and CD14hi monocytes from HIV+ and HIV− individuals with latent tuberculosis infection and active tuberculosis disease.

Freshly isolated PBMC (20 donors in each group) from HIV−LTBI+, HIV+LTBI+ individuals, HIV+TB and HIV-TB patients were stained with Abs to CD14 and TLR2. Flow cytometry was used to measure the percentages of TLR2+ cells on A. CD14low and B. CD14hi monocytes. Boxes show the median and interquartile range, and whiskers show the 5th and 95th percentile values.
