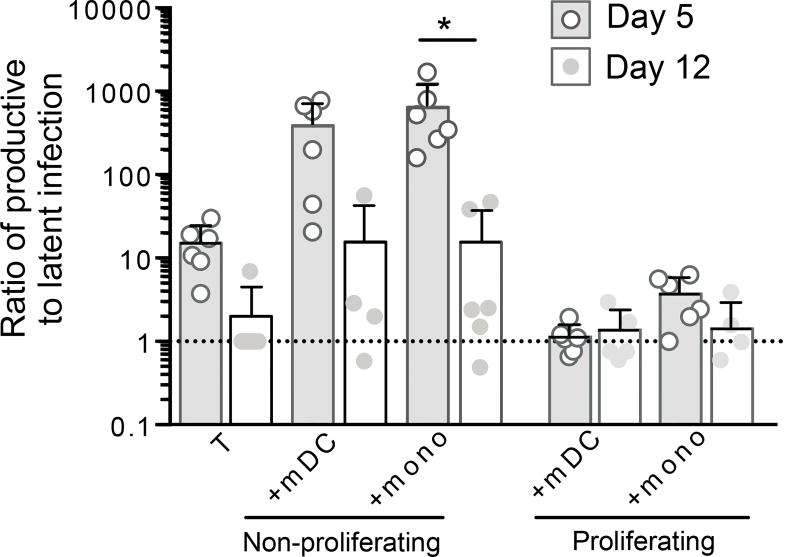
Figure 3. Proportion of productive and latent infection in non-proliferating and proliferating T cells.
The frequency of EGFP expressing T-cells before (productive) and after (latent) anti-CD3/28 stimulation was used to determine the ratio of productive to latent infection at day 5 and 12 post-infection in non-proliferating and proliferating cells post coculture with mDC or monocytes (n=4–6). Columns represent median, symbols represent results from individual donors. Significance was measured by paired students T-test where n<5 and Wilcoxon signed-rank test where n≥5, *p≤0.05, **p≤0.005, ***p≤0.0005.

