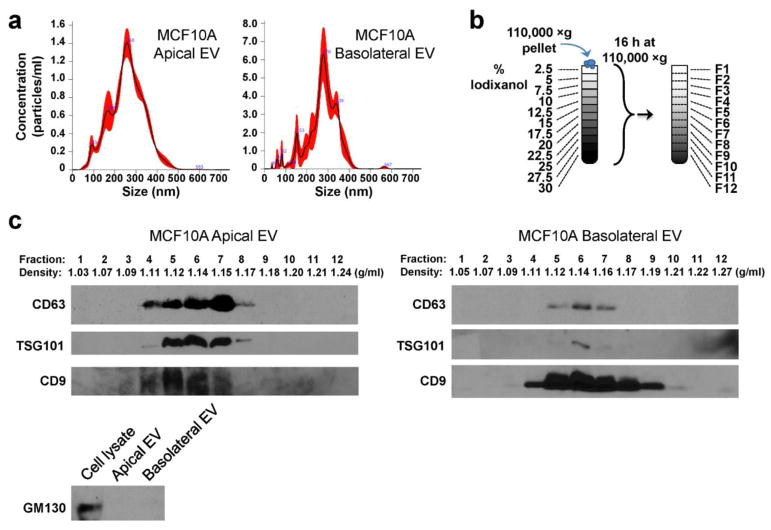
Fig. 2. Characterization of EVs.
(a) EVs pelleted at 110,000 ×g were analyzed by nanoparticle tracking analysis. The black line indicates mean, whereas the red shaded area indicates SEM. (b) A schematic representation of the gradient separation procedure to further characterize the 110,000 ×g pellets. (c) Western blot and density measurement of fractions collected from gradient separation or unfractionated EV.

