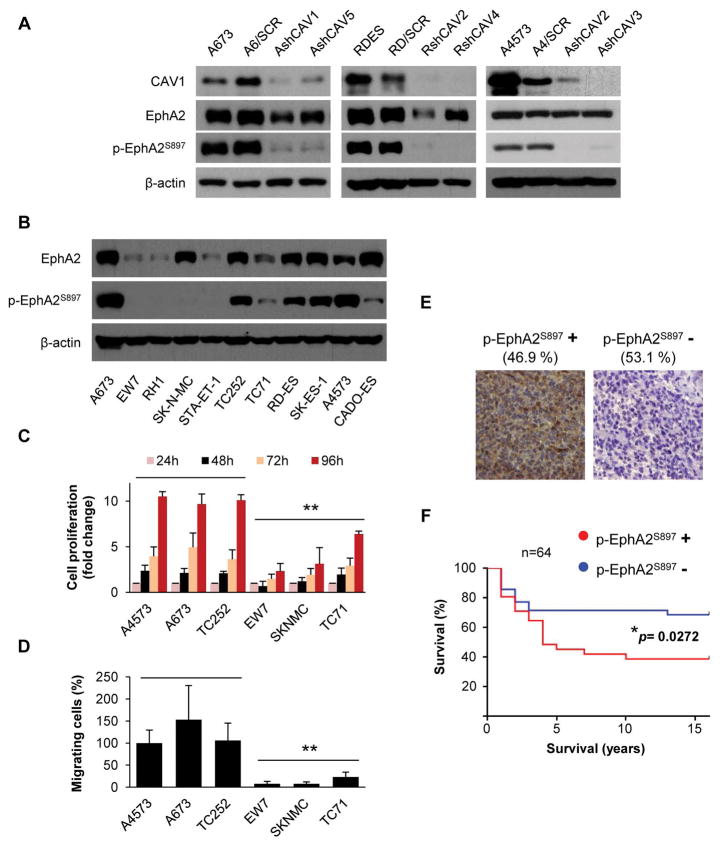
Figure 1. EphA2 receptor phosphorylation on S897 correlates with aggressiveness.
(A) Representative western blot showing EphA2 phosphorylation in Caveolin-1 (CAV1) silenced clones of A673, RDES, and A4573 cells. SCR = control scrambled sequence. (B) Representative western blot showing total EphA2 expression and its phosphorylation at S897 residue in a panel of ES cell lines. (C) WST1 tetrazolium-based proliferation assay comparing cell lines with high levels of p-EphA2S897 (A4573, A673, and TC252) versus those with low p-EphA2S897 (EW7, TC71, and SK-N-MC). (D) Migration assay in Boyden chambers in the selected panel of high or low p-EphA2S897 expression cell lines. A4573 cell line was set as reference. (E) Sample micrographs from the Ewing sarcoma tissue microarray showing differential expression pattern of p-EphA2S897. Magnification: 40×. Data are presented as means ± SD. Statistical significance was achieved by the Student’s t test from at least three different experiments: *p ≤ 0.05 **p ≤ 0.01. (F) Kaplan-Meier curve comparing differential survival of Ewing sarcoma patients in function of p-EphA2S897 expression. Long-rank (Mantel-Cox test) analysis was used to generate p value.

