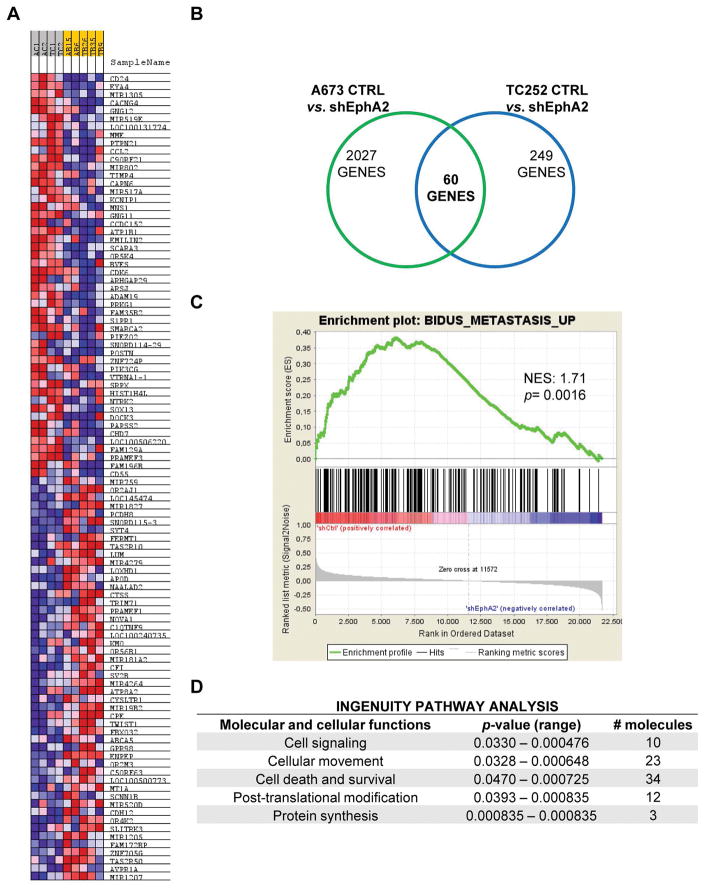
Figure 6. EphA2 participates in several regulatory pathways linked to metastasis.
(A) Heatmap of up- (red) and down- (blue) regulated genes in control cells vs. EphA2 silenced cells. (B) Venn Diagram showing the number of common genes differentially expressed after EphA2 knockdown in A673 and TC252 cell lines. (C) Gene Set Enrichment Analysis (GSEA) showing a correlation between genes differentially expressed after EphA2 silencing and those involved in metastasis. NES = Normalized Enrichment Score. (D) Ingenuity pathway analysis showing cellular processes significantly altered by EphA2 knockdown.

