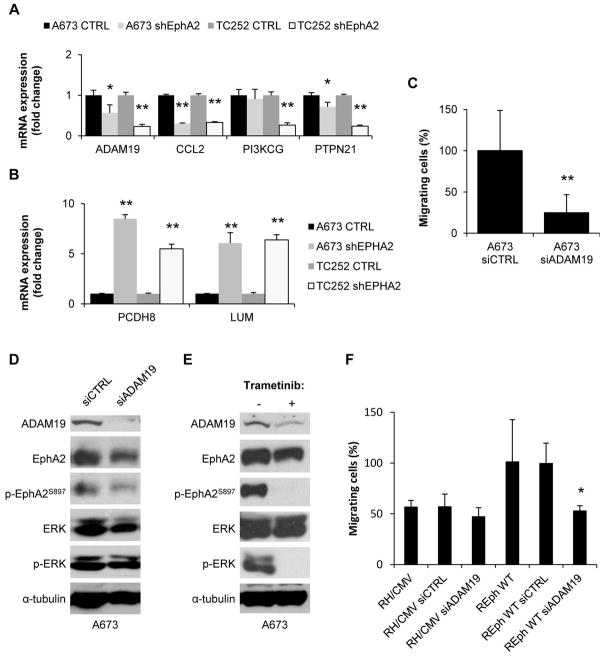
Figure 7. ADAM19 participates in the migratory behavior induced by EphA2 in ES cells.
(A–B) Validation of up- (A) and down- (B) regulated targets after EphA2 silencing by RT-qPCR in A673 and TC252 models. CTRL represents the mean from both the parental and the control vector transfected pool. shEphA2 represents the mean from the two representative clones employed through the previous experiments. (C) Migration assay in Boyden chambers after ADAM19 silencing in A673 cell line. siCTRL (= non-targeting siRNA) was set as reference. (D) Representative western blot showing ADAM19 expression and phosphorylation of EphA2 and ERK after siRNA silencing in A673 cell line. siCTRL = non-targeting siRNA. (E) Representative western blot showing ADAM19 expression and EphA2 phosphorylation after treatment with 50 nM Trametinib in the A673 cell line. ERK and p-ERK are shown as treatment efficiency controls. (F) Migration assay in Boyden chambers after ADAM19 silencing in RH1 EphA2 reintroduction model. REphWT plus siCTRL (= non-targeting siRNA) was set as reference. Data are presented as means ± SD. Statistical significance was achieved by the Student’s t test from at least three different experiments: *p ≤ 0.05 **p ≤ 0.01.

