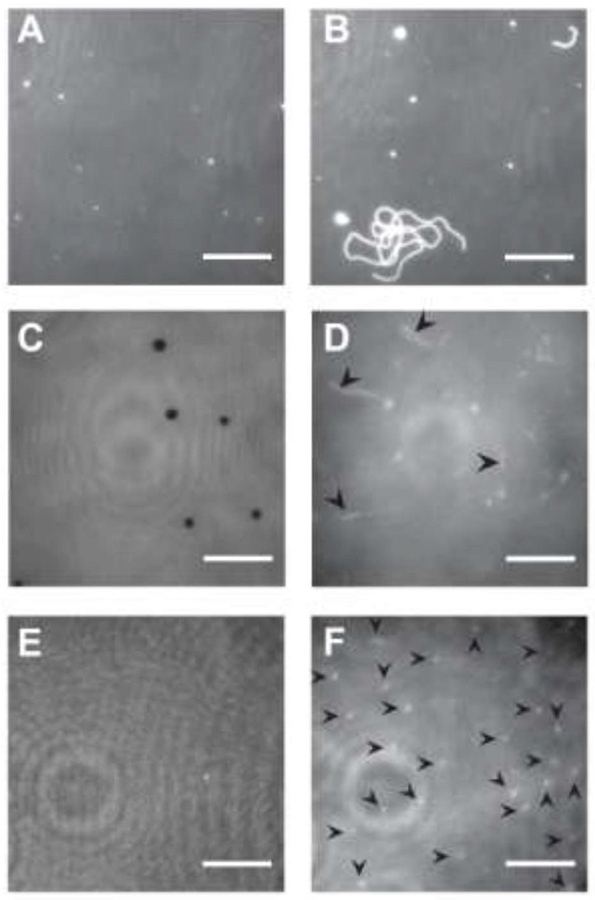
Figure 1: Spontaneous formation of lipid tubules from SLBs.

(A) Bilayer of DOPC, 0.1% LRB-DOPE in water. (B) Same sample as A, after adding Buffer A. (C) Bilayer of 3:1 DOPC/DOPS, 0.1% LRB-DOPE in water. Some regions of the surface are depleted of lipid (dark spots). (D) Same sample as C, after adding Buffer A. Arrows highlight longer tubules. Focus is away from surface in order to highlight tubules that extend vertically away from the supported bilayer. (E) A second bilayer of 3:1 DOPC/DOPS, 0.1% LRB-DOPE in water. (F) Same sample as E, containing shorter, more abundant tubules. Each arrow indicates a tubule. Image intensities have been scaled to visualize tubules, including adjusting the contrast in panels D and F. There is no indication that LRB-DOPE preferentially partitions into tubules relative to the SLB. Movie S1 corresponding to panel D is available in the Supporting Information. Scale bars 10 μm.
