Figure 9.

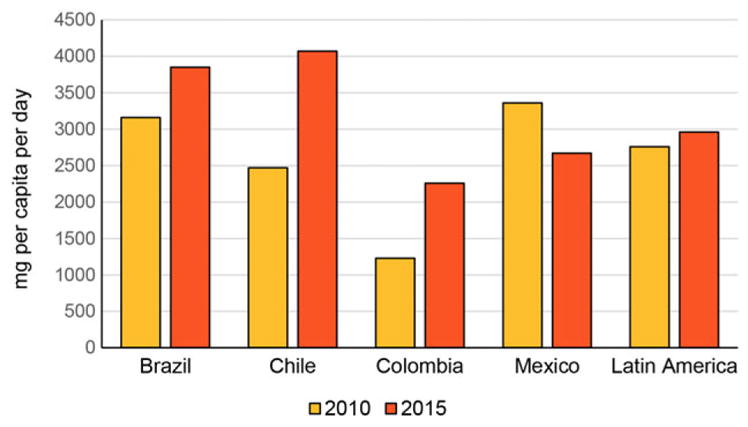
Combined retail and food service daily per capita sodium sales, 2010 and 2015. Source: Euromonitor International Limited 2018© All rights reserved.

Combined retail and food service daily per capita sodium sales, 2010 and 2015. Source: Euromonitor International Limited 2018© All rights reserved.