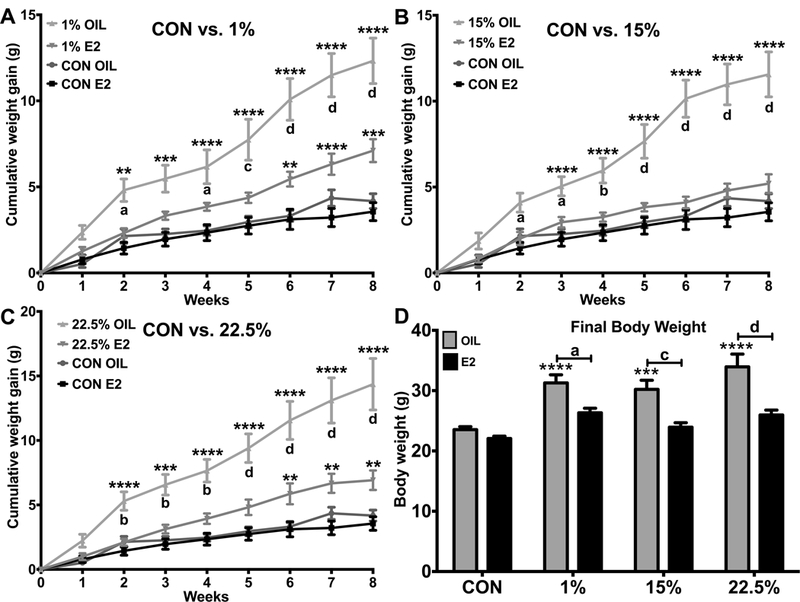
Figure 1: Body weight gain.

A. Weekly weight gain of CON vs. 1% fed oil and E2 treated mice. Two-way ANOVA: interaction time*treatment (txt): F (24, 352) = 16.11; p < 0.0001. B. Weekly weight gain of CON vs. 15% fed oil and E2 treated mice. Two-way ANOVA: interaction time*txt: F (24, 352) = 17.23; p < 0.0001. C. Weekly weight gain of CON vs. 22.5% fed oil and E2 treated mice. Two-way ANOVA: interaction time*txt: F (24, 352) = 16; p < 0.0001. D. Cumulative weight gain over 8 weeks. Two-way ANOVA: interaction: diet*steroid: F (3, 88) = 2.845; p < 0.05. Data are represented as means ± SEM. Sample size for each group was 12. Data were analyzed by two-way ANOVA (repeated measures or standard) with post-hoc Bonferroni multiple pairwise comparisons test. Letters denote comparisons within diet between steroid treatments; asterisks denote comparisons within steroid treatment between HFD and CON. Comparisons within steroid, between HFDs are denoted with asterisks over capped lines. (*& a = p<0.5; ** & b = p<0.01; *** & c = p<0.001; **** & d = p<0.0001).
