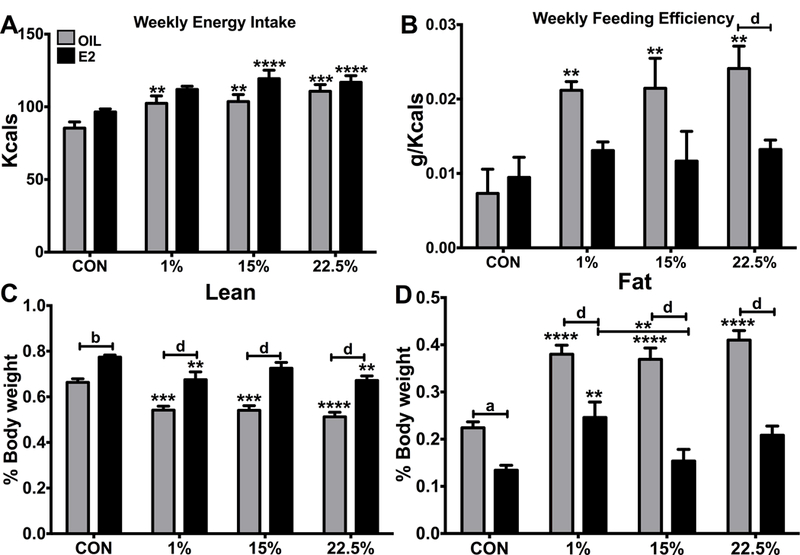
Figure 2: Feeding and body composition.

A. Weekly average food intake. Two-way ANOVA: diet: F (3, 56) = 11.19; p < 0.0001, steroid: F (1, 56) = 11.9; p < 0.01. B. Weekly average feeding efficiency. Two-way ANOVA: diet: F (5, 39) = 5.079; p < 0.01, steroid: F (1, 39) = 11.07; p < 0.01. C. Lean mass as a percent of body weight. Two-way ANOVA: diet: F (3, 87) = 14.21; p < 0.0001, steroid: F (1, 87) = 95.56; p < 0.0001. D. Fat mass as a percent of body weight. Two-way ANOVA: diet: F (3, 87) = 17.17; p < 0.0001, steroid: F (1, 87) = 112.6; p < 0.0001. Data are represented as means ± SEM. Sample size for each group was 12. Data were analyzed by two-way ANOVA with post-hoc Bonferroni multiple pairwise comparison tests. Letters denote comparisons within diet between steroid treatments; asterisks denote comparisons within steroid treatment between HFD and CON. Comparisons within steroid, between HFDs are denoted with asterisks over capped lines. (*& a = p<0.5; ** & b = p<0.01; *** & c = p<0.001; **** & d = p<0.0001).
