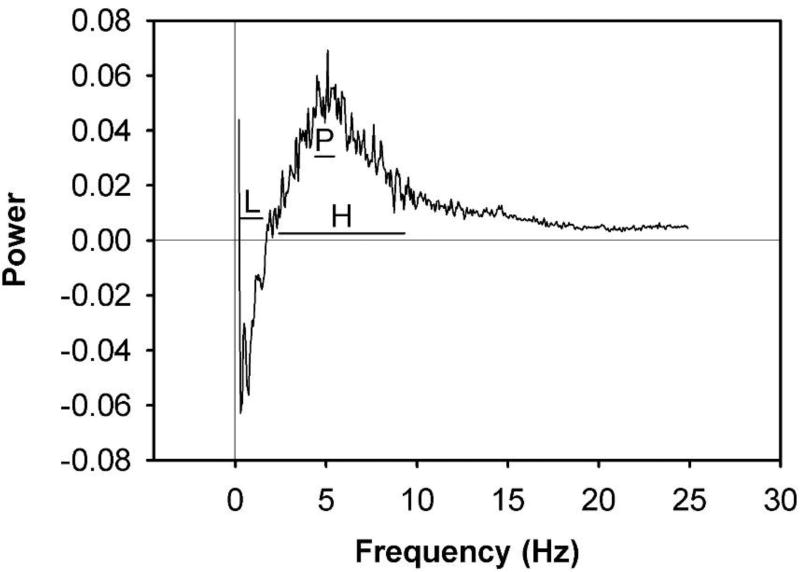
Figure 7.
Fourier-transformed difference power spectrum of FPA force/time recordings of female rats following hind paw injection of 5% formalin. Rats were either naïve or injected with 100 µL 5% formalin into the left hind paw, then were placed in the FPA for one hour. The mean power spectrum for Naïve (n = 6) rats was subtracted from that of formalin-treated (n = 6) rats. Results revealed a differential power spectrum with potentially significant magnitudes. Data represent the mean power spectrum. For more detailed analysis of this difference in movement power, frequency bands of the power spectra were designated and are superimposed on the difference power spectrum of 5% formalin. Horizontal lines represent frequency band (range) designations of the power spectrum. The frequency band designations are: Low (L): 0.3–1.5 Hz; Peak (P): 4.4–5.4 Hz; High (H): 2.4–9.3 Hz.

