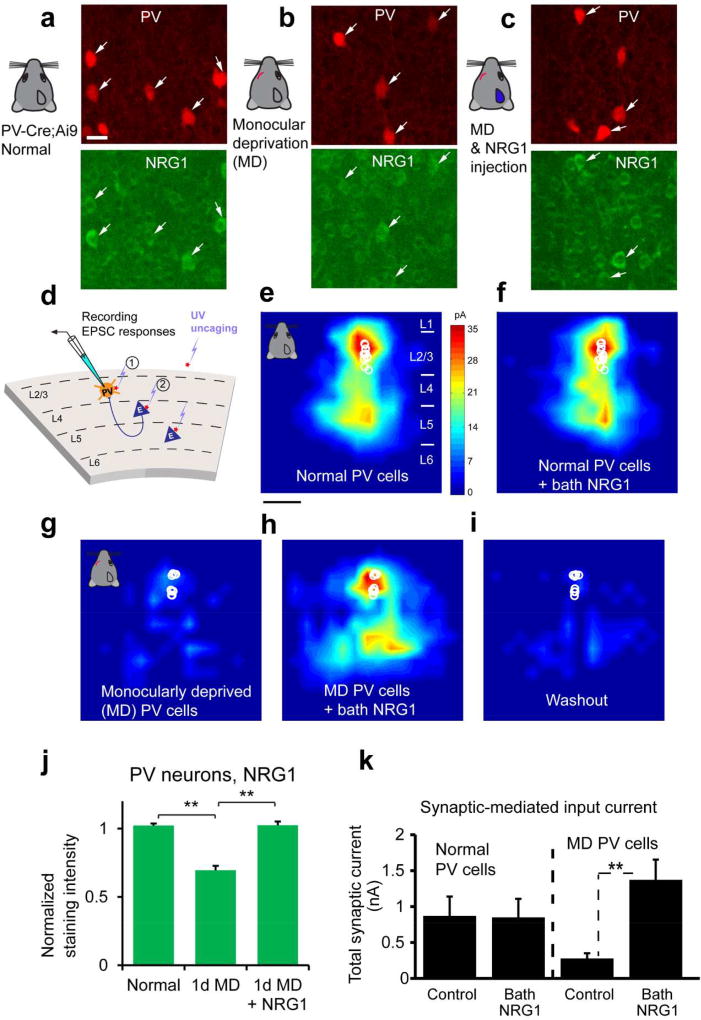
Figure 2. Monocular deprivation rapidly down regulates NRG1 in PV neurons of visual cortex during the critical period and exogenous NRG1 rapidly restores excitatory synaptic input onto these deprived PV neurons.
a–c, Immunochemical analysis of NRG1 signaling. Representative images of NRG1 immunostaining are shown for (a) PV neurons in the PV-Cre; Ai9 mouse at postnatal day 28, (b) after 1 day of monocular deprivation (1d MD), and (c) after 1d MD with NRG1 injections [3 times (3×) daily, 0.5 µg NRG1 per mouse]. The image panels are contrast enhanced for the display, but not for quantitative analysis. The arrows indicate tdTomato+ PV cells (red) and their corresponding immunolabel (green). Scale bar = 20 µm. d, Schematic of laser scanning photostimulation (LSPS) mapping of local synaptic connections to individually recorded PV neurons in V1 slices. e–f, Acute bath application of NRG1 (5 nM) does not significantly modulate local excitatory synaptic inputs and glutamate mediated excitability of normal PV neurons in non-deprived binocular V1 of control mice. Group-averaged, excitatory input maps of L2/3 PV cells (n = 13 cells) are shown for before (e) and during bath NRG1 (20 minutes after NRG1 application) (F). White circles represent individual PV neurons. The color scale (e) codes integrated excitatory input strength (blue = low, red = high) and applies to all other maps. The spatial scale beneath (e) indicates 200 µm. PV neurons in mice with 1–2 days of monocular lid suture show dramatically lower excitatory synaptic inputs compared to controls (g, n = 10 cells). However, excitatory inputs to PV neurons in these deprived mice are restored to levels above that of controls by acute bath application of NRG1 (h). This restoration is eliminated by washout of bath NRG1 (i). J–K, quantitative data summaries. A bar graph in (j) shows that the average NRG1 immunostaining signal in L2/3 PV cells significantly differs following 1 d MD but does not differ between control and 1 d MD + NRG1. PV cell measurements in (j) were obtained from 4–6 different mice for each condition. **, p < 0.01 (Kruskal Wallis test, followed by Mann–Whitney U tests). On average, 1d MD PV cells express significantly less NRG1 signal (67.9%) relative to normal control; PV cells of 1d MD occluded by NRG1 injections express similar levels of NRG1 signal relative to control. k, Summary data of average total synaptic input strength measured for L2/3 PV neurons under the specified conditions (d–i). ***, p < 0.001. These data demonstrates how activity-dependent NRG1 signaling and sensory experience interacts to rapidly shape functional circuit connections in the cortex. The figure is modified from published data figures in Sun et al. (2016) with permission from the Cell Press.

