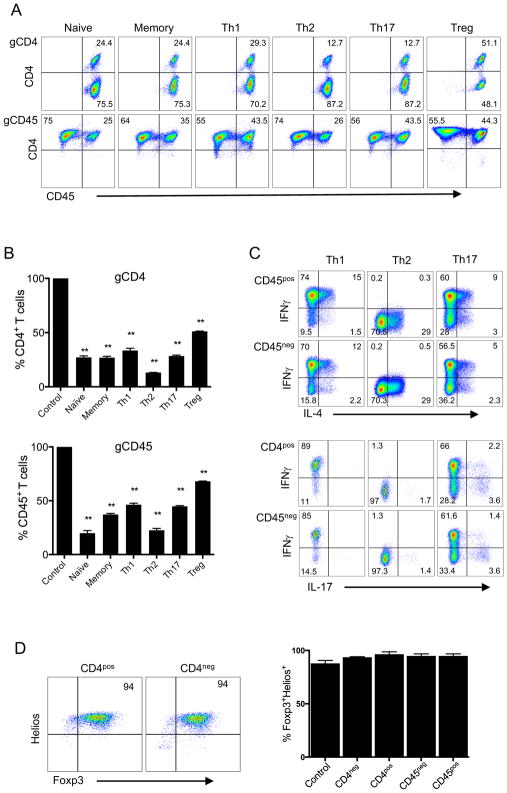
FIGURE 2. CRISPR-mediated gene deletion in primary human T cell subsets.
(A) CD4 or CD45 expression upon CRISPR/Cas9-targeted deletion of these genes in different T cell subsets. Purified CD4+ T cells were sorted via flow cytometry using the following markers: CD45RO−CCR7+CD25− (Naïve), CD45RO+CD25− (Memory), CD45RO+CCR6−CCR4−CXCR3+ (Th1), CD45RO+CCR6−CXCR3−CCR4+ (Th2), CD45RO+CCR6+ (Th17) and CD45RO−CD25+ (nTreg). CD4+ T cells were activated with anti-CD3/anti-CD28 beads and transduced with lentiviruses targeting the CD4 (gCD4-g1 top panel) or CD45 (gCD45-g1, bottom panel) genes, as in Figure 1. Transduced cells were expanded for two weeks with IL-2, without selection, and stained with CD4 and CD45 antibodies. (B) Proportion of CD4 or CD45 postive cells within T cell subsets after CRISPR/Cas9 targeted deletion. CD4 or CD45 expression was determined in each T cell subset as in 2A, after two weeks post targeting either CD4 (gCD4-g2, top panel) or CD45 (gCD45-g1, bottom panel) respectively. Expresson of CD4 or CD45 was 100% in all T cell subsets transduced with control lentiviruses (Control). Data represent three independent experiments.Error bars represent SEM. **p<0.01. (C) Cytokine expression in T cell subsets after lentiviral transduction. Th1, Th2, and Th17 subsets expanded in vitro as in A, were restimulated with PMA and Ionomycin for 4 hours in the presence of GolgiStop. The expression of IFNγ, IL-4 and IL-17 was assessed by intracellular cytokine staining. FACS plots show IL-4, IFNγ and IL-17 expression in CD45+ and CD45− populations. (D) Foxp3 and Helios expression in Tregs after lentiviral transduction. Naïve Tregs (nTregs) were activated with anti-CD3/anti-CD28 beads and transduced with gCD4 or gCD45 lentiviruses the next day. nTregs were expanded in IL-2 for 2 weeks without selection. Expanded nTregs were stained for intracellular Foxp3 and Helios expression and analyzed after gating on CD4+ or CD4− population. The bar graph shows Foxp3+Helios+ cells after gating either on CD4+ and CD4− or CD45+ and CD45− in cells transduced with lentiviruses encoding gCD4-g1 or gCD45-g1 respectively. Control in bar graph is T cells transduced with empty vector lentivirus. Data are representative of two independent experiments.

