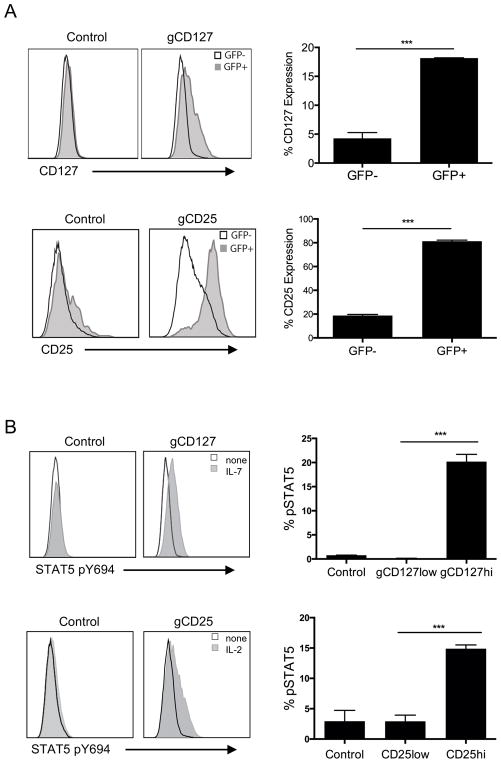
FIGURE 6. Functional CD127 and CD25 gene expression on primary CD4+ T cells using CRISPR-mediated promoter activation.
(A) Expression of CD127 (top left) and CD25 (bottom left) in primary CD4+ T cells transduced with gRNA targeting CD127 or CD25 promoter. Primary CD4+ T cells were activated with anti-CD3/anti-CD28 beads, transduced with lentiviruses expressing dCas9 and p65 proteins and selected with hygromycin. After 2 weeks expansion, dCas9 and p65 expressing cells were then reactivated with anti-CD3/anti-CD28 beads and transduced with lentiviruses targeting CD127 (gCD127) or CD25 (gCD25) promoters, selected with zeocin and expanded for 2 weeks. The histograms show expressions after gating on GFP+ (gray histogram) and GFP− cells (empty histogram), GFP being the marker for dCas9 expression. Percentgate of CD127 (top right) or CD25 (bottom right) expression in primary CD4+ T cells transduced with CD25− or CD127− promoter targeting gRNAs, between GFP+ or GFP− population (as in Figure 6A). Data represent three independent experiments. Error bars represent SEM. ***p<0.001. (B) Increased phosphorylated (pY694) Stat5 expression in promoter-induced cytokine receptor populations in primary CD4+ T cells transduced with gRNA targeting CD127 or CD25 promoter. Histogram overlays of phosphorylated (pY694) Stat5 expression in CD127hi population in CD127-expression induced CD4+ T cells stimulated with 3ng/ml IL-7 (gray histogram) compared to non-stimulated (empty histogram) and CD25hi population in CD25-expression induced CD4+ T cells stimulated with 1ng/ml IL-2 (gray histogram) compared to non-stimulated (empty histogram). Bottom panel represents pSTAT5 induction in T cells transduced with empty vector (control) gated on total cells, gCD127 (gated on CD127low and CD127hi, top) or gCD25 (gated on CD25low and CD25hi, bottom). Data represent three independent experiments. Error bars represent SEM. ***p<0.001.

