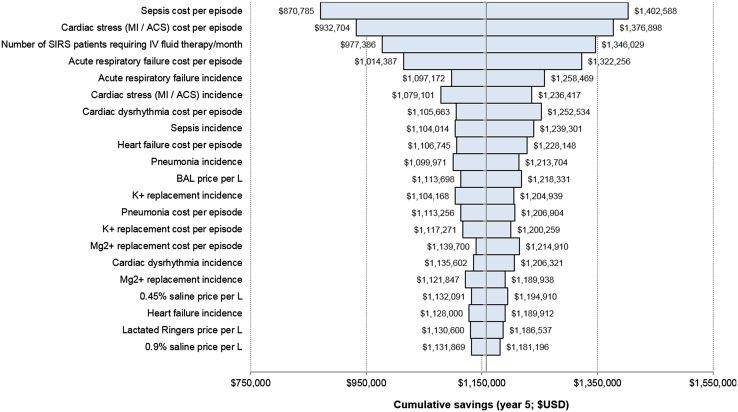
Fig. 1.
Probabilistic sensitivity analysis of cumulative 5-year savings. This figure presents the results of the user inputs of the probabilistic sensitivity analysis. All parameters were assumed to be Normally distributed and varied simultaneously with means and standard deviations as specified in Supplementary Table 3 (see ESM). Bars represent maximum and minimum cumulative savings associated with changes in the model input values. The midline represents the mean cumulative savings at US$1.16M, with 95% CI between US$1.15 and US$1.18 M. Inputs are ranked by effect on cumulative 5-year savings. BAL calcium-free balanced crystalloid solution, MI/ACS myocardial infarction/acute coronary syndrome, SIRS systemic inflammatory response syndrome

