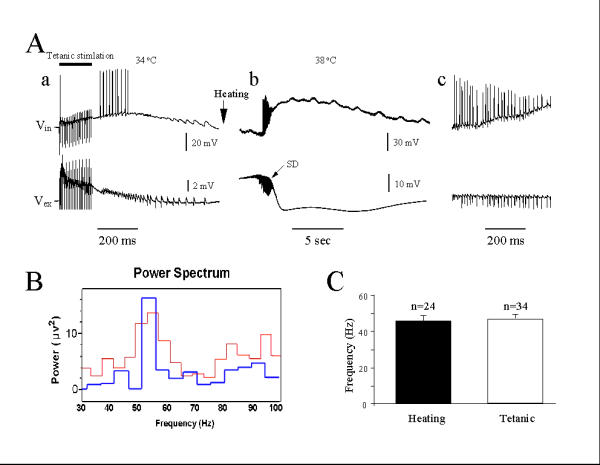
Figure 2.

Comparison of hyperthermic and post-tetanic γ oscillations. (A): a. Post-tetanic stimulation (100 Hz, 20 trains, 2 mA, 100 μs) induced γ oscillation at 34°C. b. Heating the same recorded slice to 38°C induced an initial γ oscillation accompanied by a slow SD. c. Expanded time scale shows the similar frequency ranges of post-tetanic and hyperthermic oscillations. (B): Comparison of frequency power by power spectrum analysis between Aa and Ab. (C) There is no significant difference of average frequency between post-tetanic and hyperthermic oscillations.
