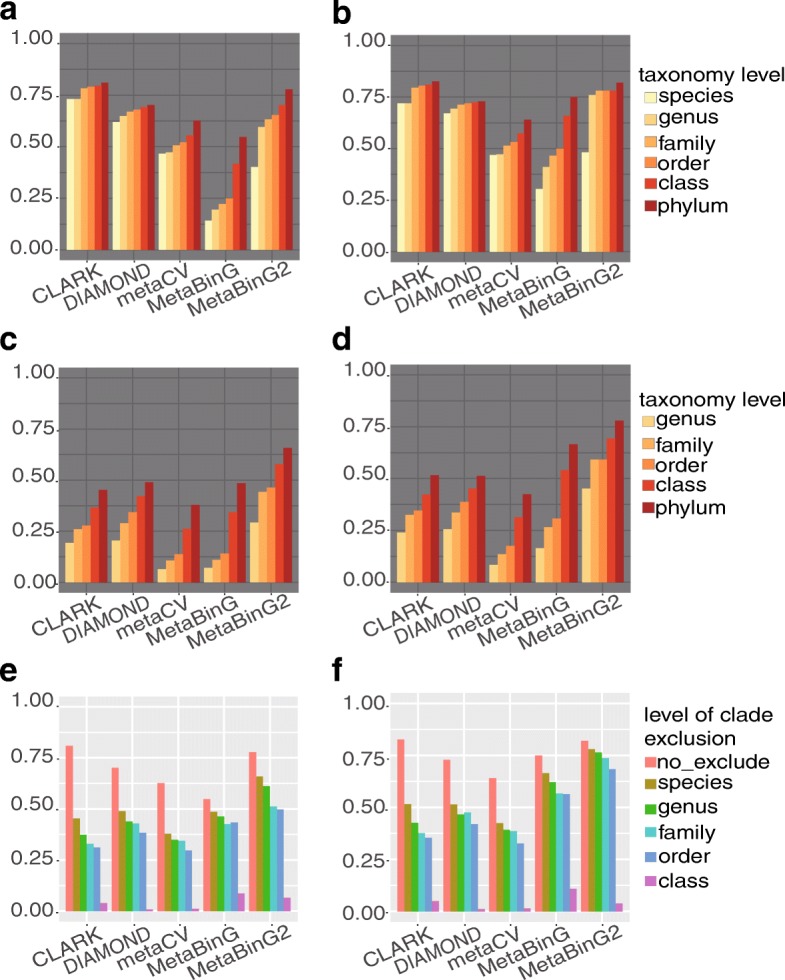
Fig. 3.

Accuracy evaluation with simulated datasets against reference databases with/without clade exclusion. Tested scenarios include: a, b no exclusion, c, d species level clade exclusion, and e, f all level of clade exclusion. In a, b, all genomes in the query datasets were included in the reference database and query sequence length is 100 bp (a) and 250 bp (b); In c, d all species in the query datasets were excluded in the reference database. The accuracy was measured on clade levels from species to phylum (a-d). e, f accuracy evaluation at phylum level, and different levels of clades were excluded in the reference database. In a, c, e the query sequence length is 100 bp, and in b, d, f the query sequence length is 250 bp. Y-axis in all Fig. 3 stands for the accuracy (see details in Methods). Here, CLARK and DIAMOND are alignment-based methods and the others are composition-based methods
