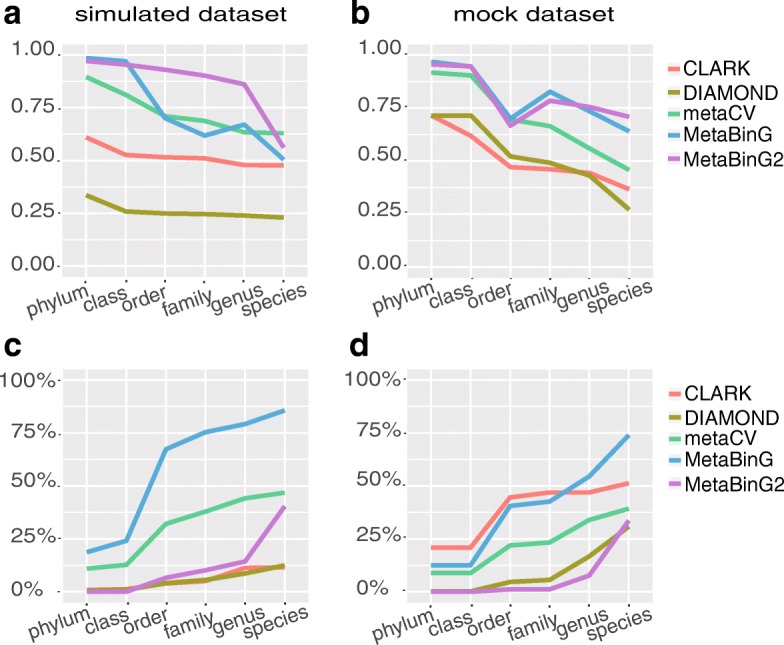
Fig. 4.

Evaluation for community composition structure prediction ability of each tool. a, b The consistency between the predicted community composition structure and the true community composition structure. Y-axis stands for consistency level reflected by cosine value. In a the query dataset was simulated dataset (with sequence length of 100 bp), and in b the query dataset was mock dataset. c, d Over-prediction of each tools. The Y-axis stands for the proportion of query sequences assigned to genomes outside of the true source genomes (not include the unclassified part). In c the dataset was simulated dataset (with sequence length of 100 bp), and in d the dataset was mock dataset with known composition structure. Here, CLARK and DIAMOND are alignment-based methods and the others are composition-based methods
