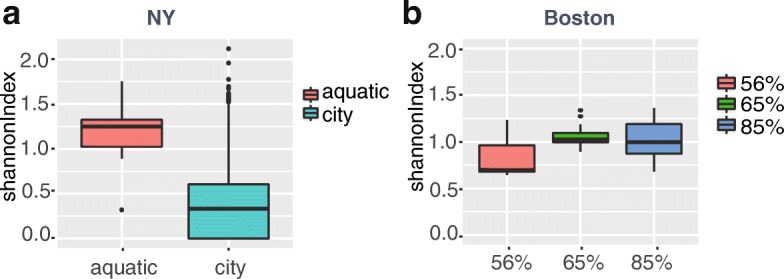
Fig. 6.

Relationship between factors and community diversity in NY and Boston sample. a Community diversities in NY samples are significantly related to the sampling location (p-value< 0.0001). b Community diversities in Boston samples are significantly related to humidity (p-value< 0.01). Y-axis stands for the Shannon index calculated by the phyla distribution of a sample
